Ct determination by cluster analysis with variable cluster endpoint

a cluster analysis and cluster endpoint technology, applied in the field of systems and methods for processing data representing sigmoid type curves or growth curves, can solve the problems of many parameters that are often difficult to optimize, all of these methods have drawbacks, and the normalization of data may also provide additional problems

Active Publication Date: 2011-08-02
ROCHE MOLECULAR SYST INC
View PDF9 Cites 6 Cited by
  • Summary
  • Abstract
  • Description
  • Claims
  • Application Information

AI Technical Summary

Problems solved by technology

All of these methods have drawbacks.
Normalization of the data may also provide additional problems.
Furthermore, these algorithms typically have many parameters that are often difficult to optimize.
This results in a trade-off between sensitivity and false positives that reduces the effectiveness of these algorithm approaches.

Method used


Image

  • Ct determination by cluster analysis with variable cluster endpoint
  • Ct determination by cluster analysis with variable cluster endpoint
  • Ct determination by cluster analysis with variable cluster endpoint

Examples


examples

[0060]The processes of the present invention are particularly useful in PCR systems, such as thermocyclers, to significantly improve the quality of the PCR results data. Examples of data processed according to the present invention are discussed below.

[0061]FIG. 8 shows an example of a plotted data set analyzed according to the present invention. This particular data set was difficult to analyze with existing algorithms. When processed through the Cluster Ct Analysis approach of the present invention, the Ct value was determined to be 13.1.

[0062]FIG. 9 shows another example of a plotted data set analyzed according to the present invention. This data set, when processed using the Cluster Ct Analysis approach of the present invention, gave the Ct value as 35.9. A traditional approach, which involved normalization, had difficulty with this data set.

[0063]FIG. 10 shows an example of plots of the resultant fluorescence signal from 10 identical samples processed through a thermal cycler a...


PUM

PropertyMeasurementUnit
cycle thresholdaaaaaaaaaa
Ctaaaaaaaaaa
fluorescence intensityaaaaaaaaaa

Abstract

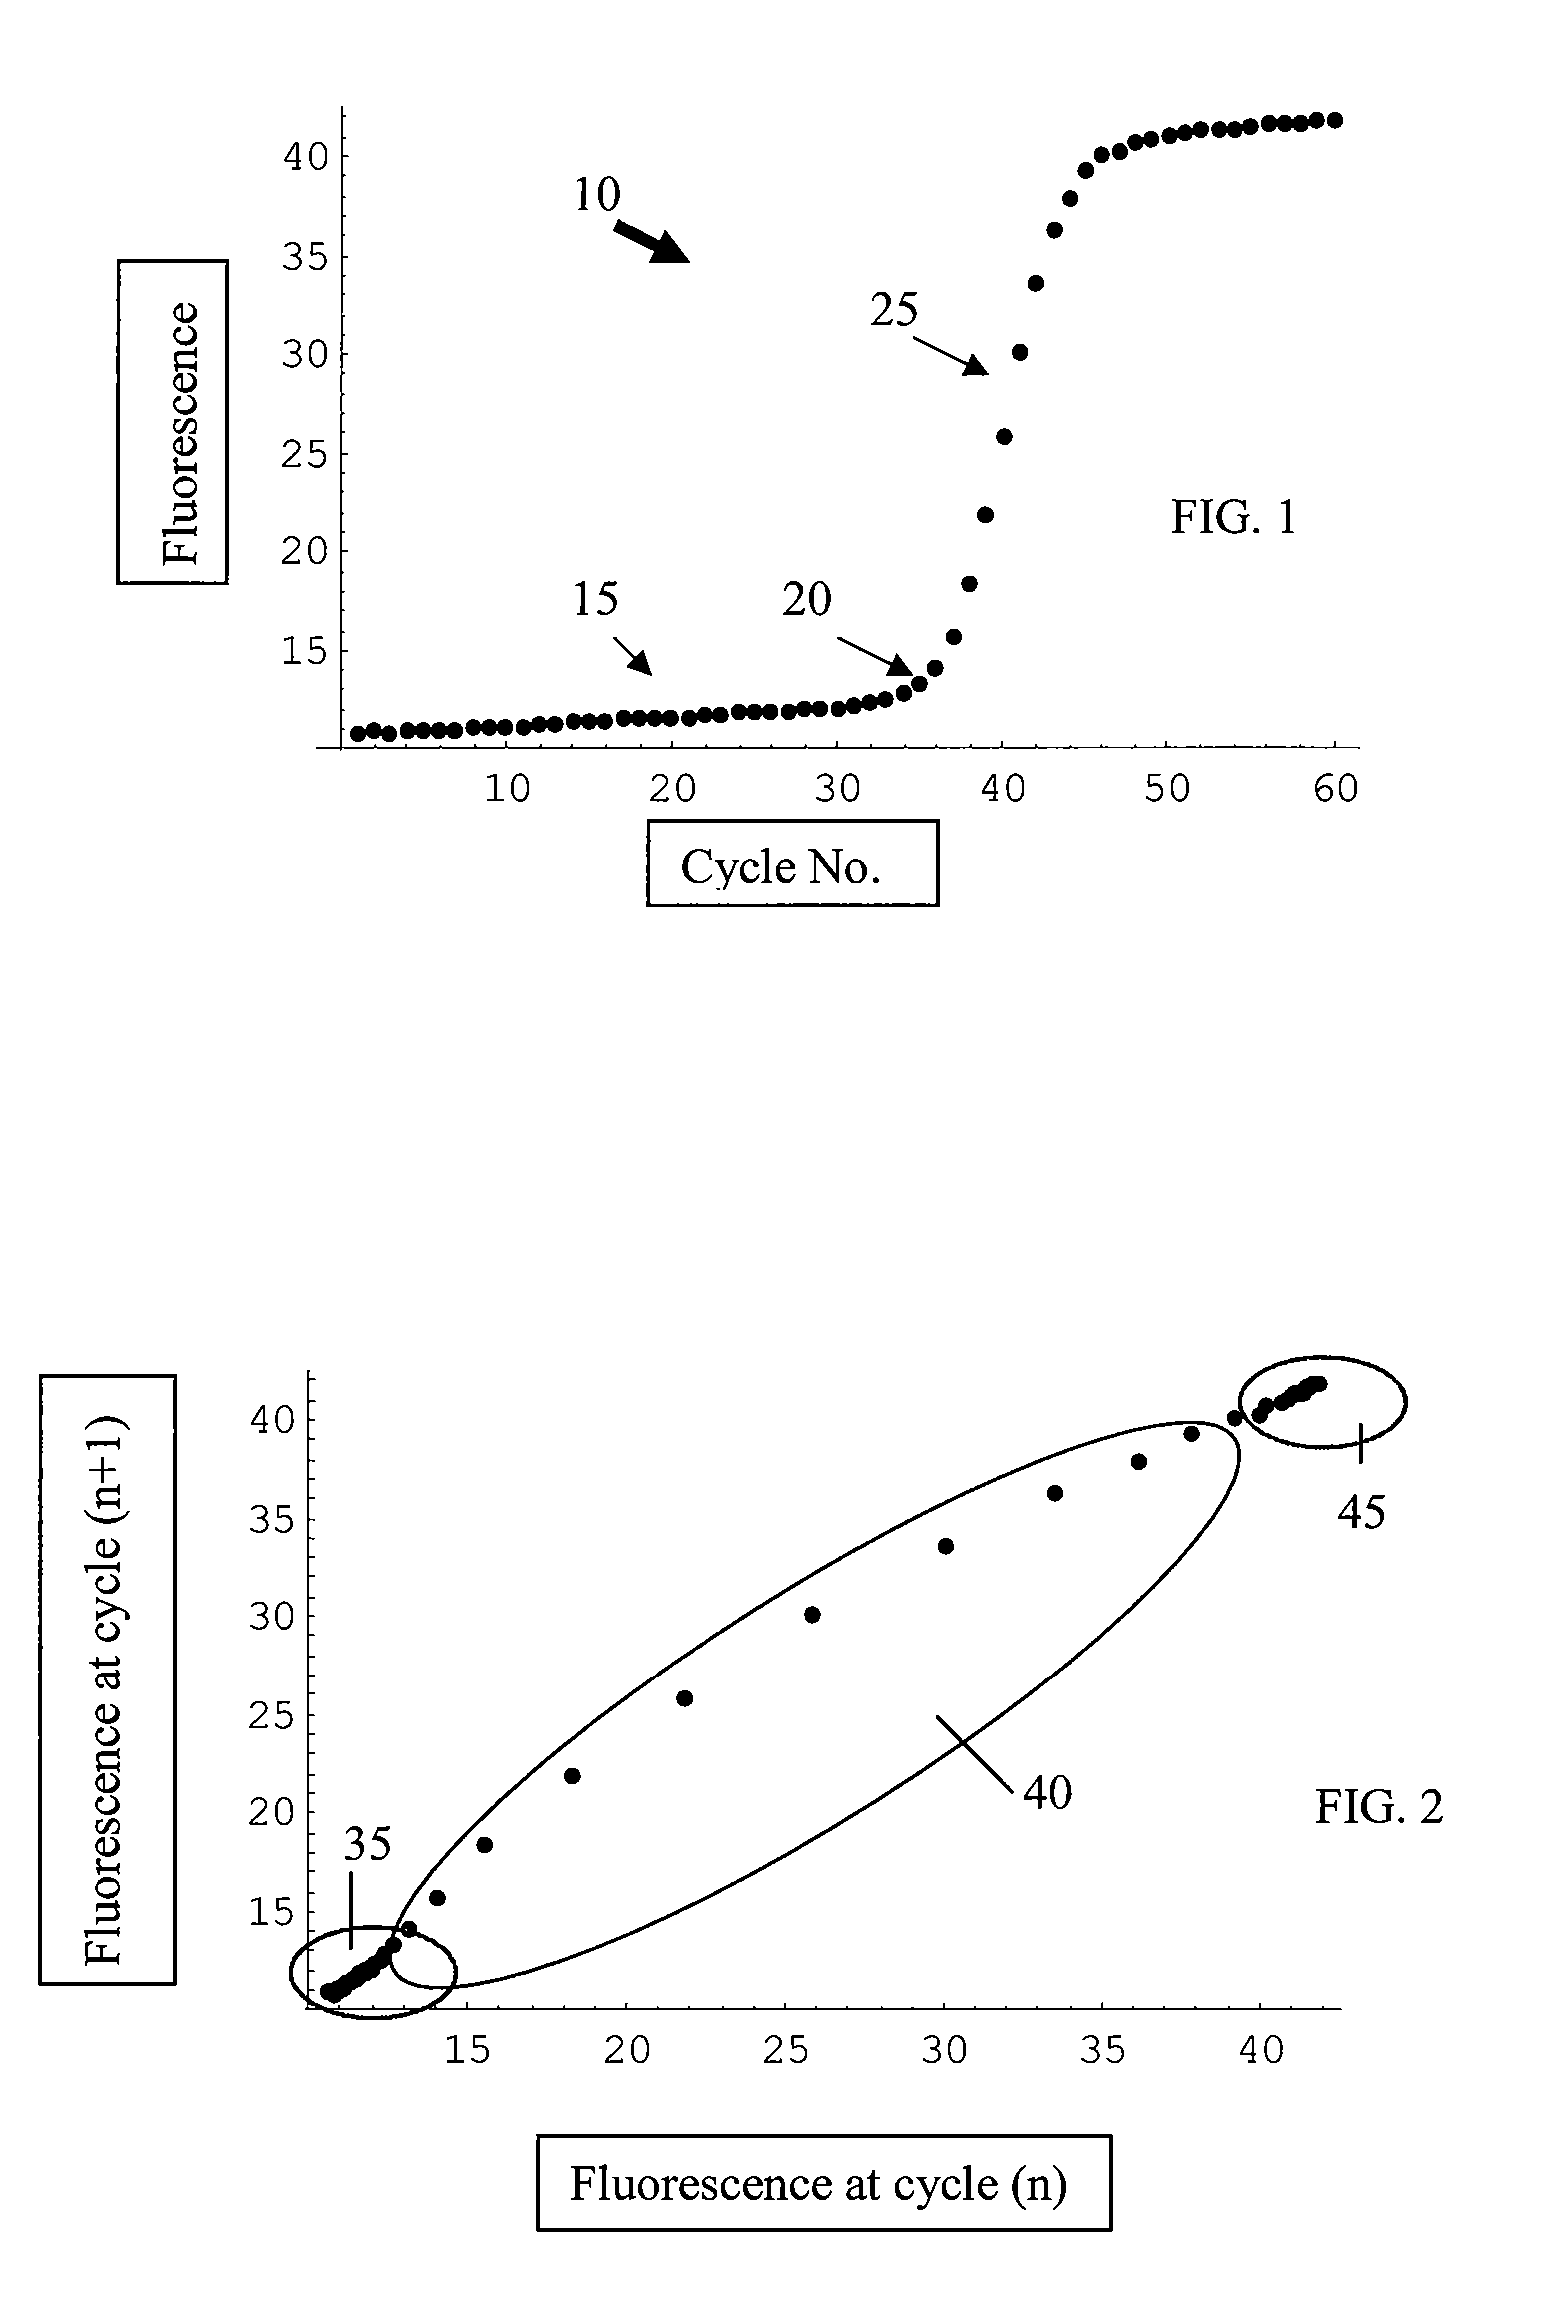
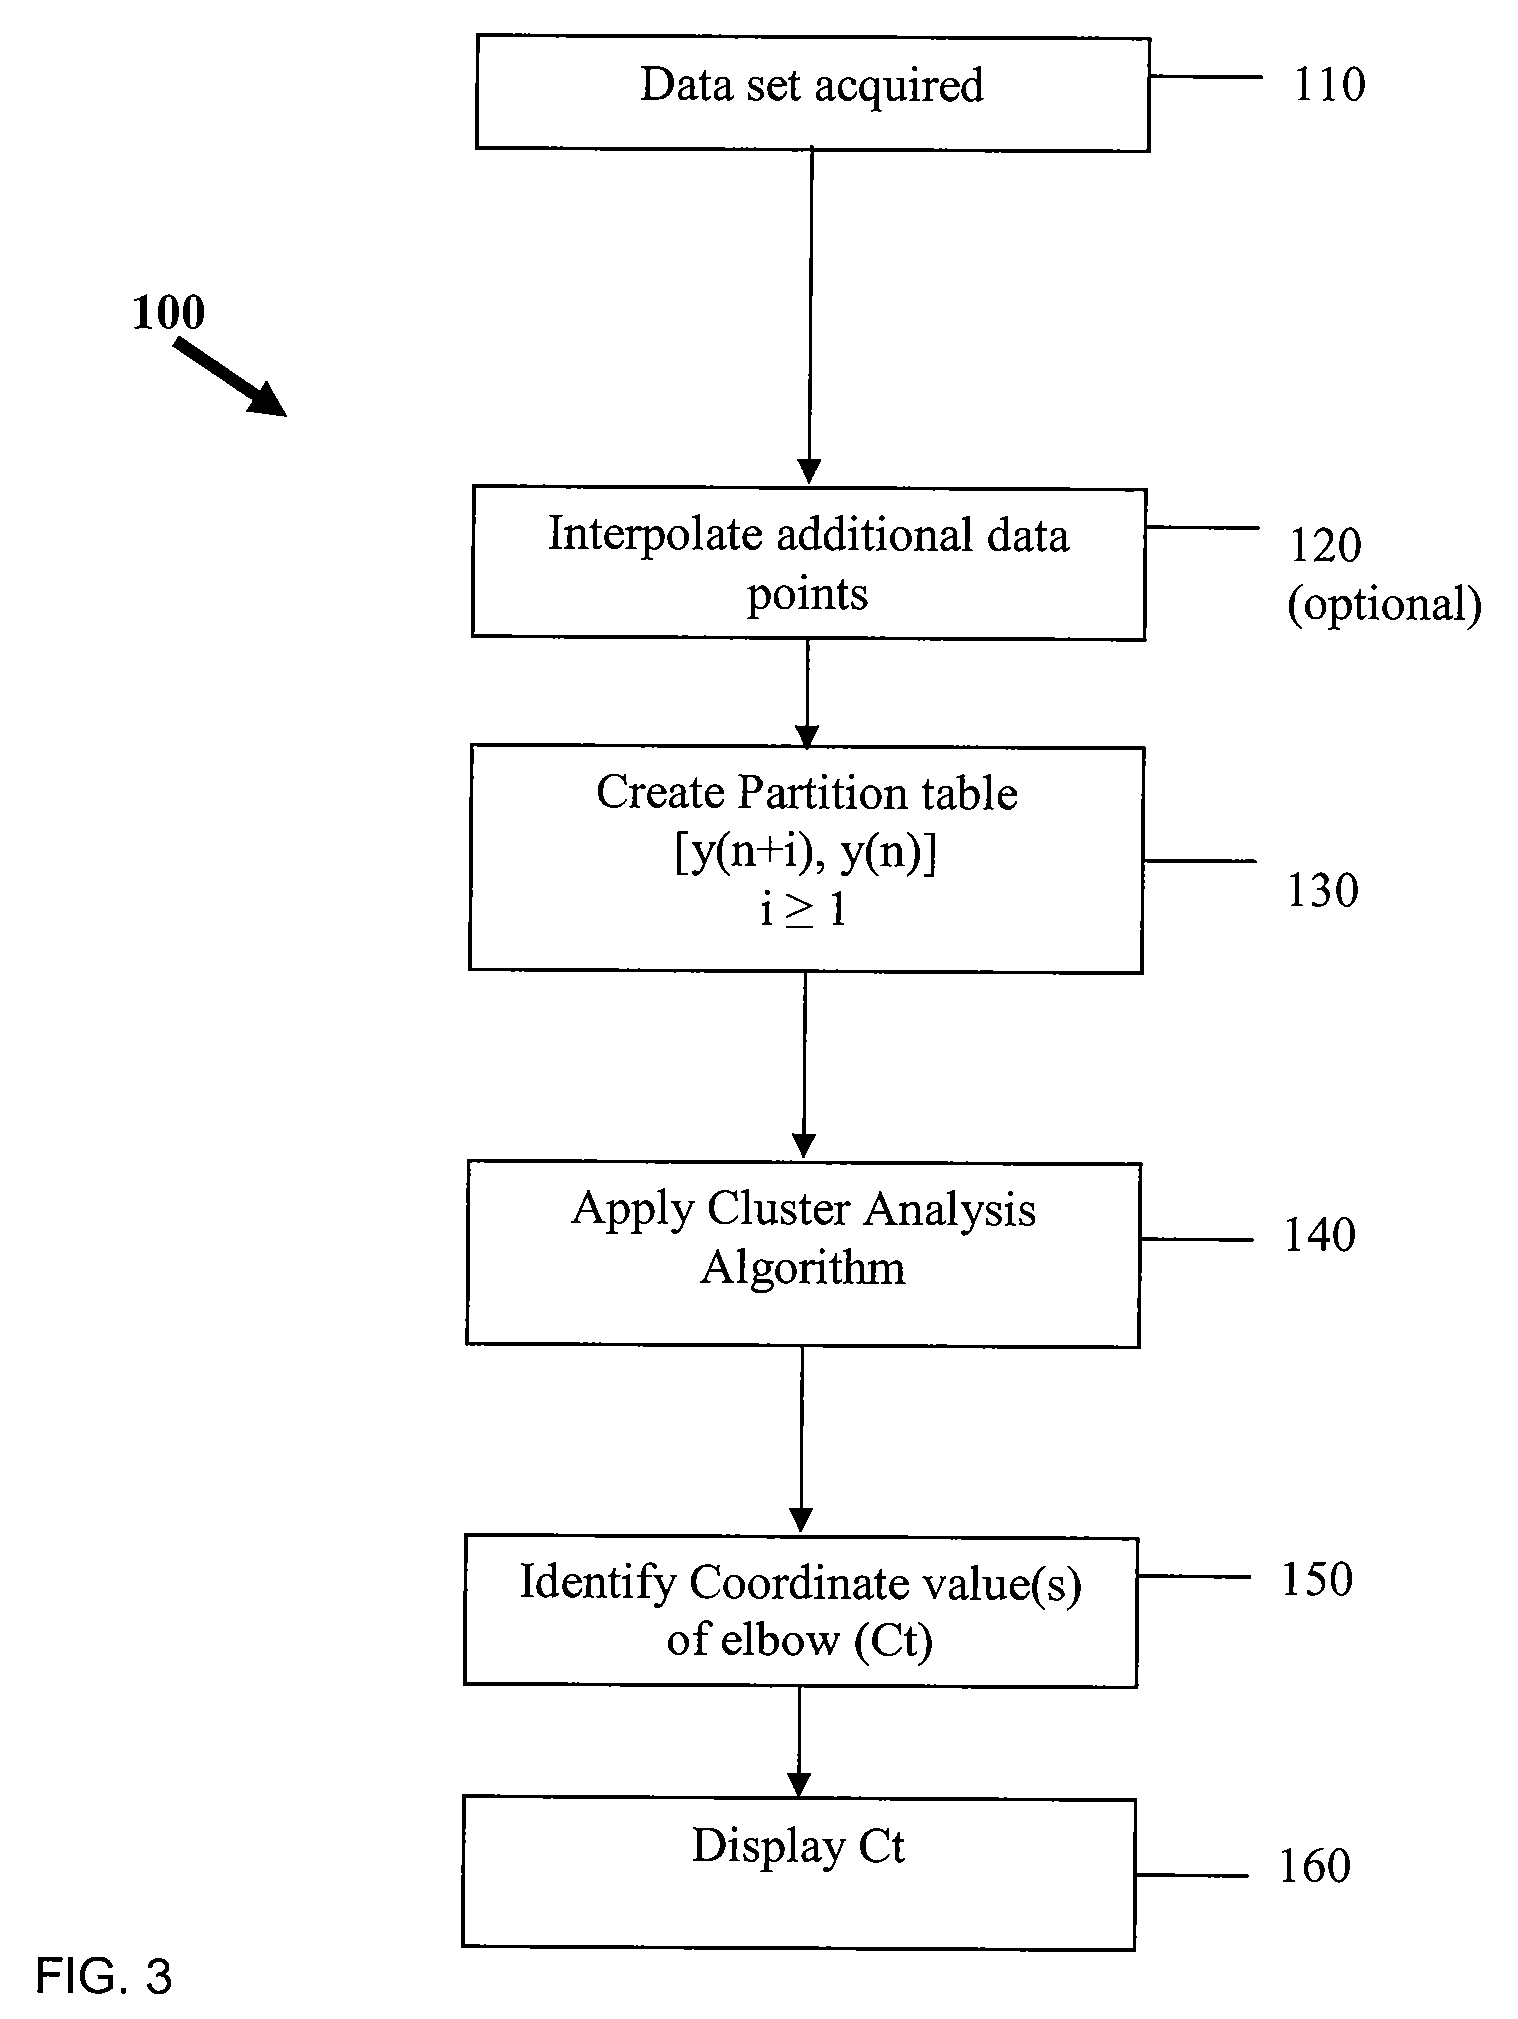
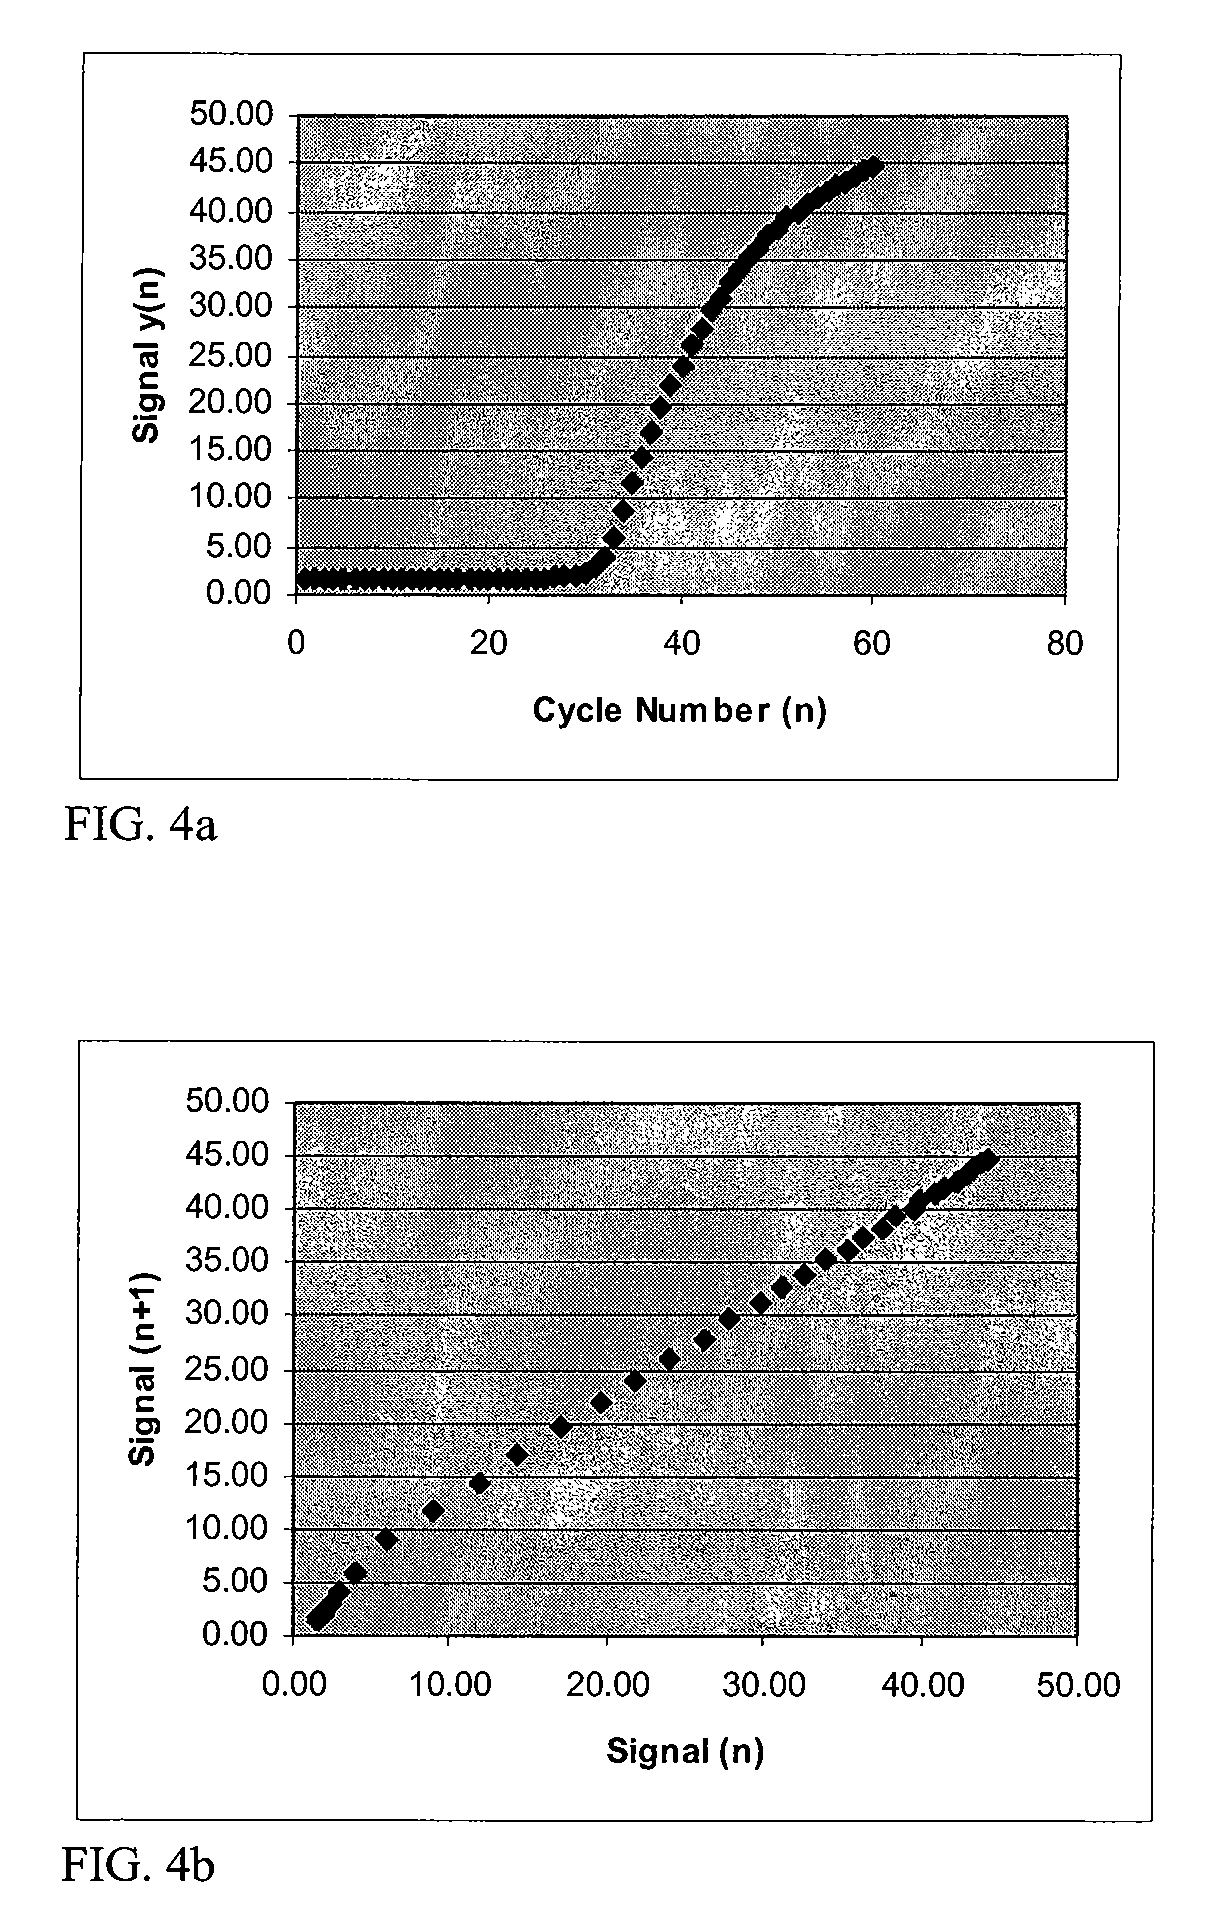
Systems and methods for determining the cycle threshold (Ct) value in a kinetic PCR amplification curve. The PCR data set may be visualized in a two-dimensional plot of fluorescence intensity (y-axis) vs. cycle number (x-axis). The data set is transformed to produce a partition table of data points with one column including the fluorescence at cycle (n) and a second column including the fluorescence at cycle (n+i), where i is typically 1 or greater. A cluster analysis process is applied to the partition table data set to determine a plurality of clusters in the partition table data set. In one aspect, the clustering process used includes a k-means clustering algorithm, where the number of identified clusters, k, is greater than or equal to three. In another aspect, a Partitioning Around Medoids (PAM) algorithm is used to identify three or more clusters. Using the identified clusters, a linear slope of each of the clusters is determined based on y(n+1) vs. n, and for each cluster, a ratio of the slope of that cluster with the slope of an adjacent cluster is determined. The ratios are then compared. An end point of a cluster having the largest or smallest ratio represents a specific point of interest in the data curve. The data point representing the elbow or Ct value of the PCR curve is identified as an end point of one of the identified clusters, and the cycle number corresponding to this data point is returned or displayed.

Description

CROSS-REFERENCES TO RELATED APPLICATIONS[0001]This application is a continuation-in-part (CIP) of the U.S. application Ser. No. 11 / 241,772, filed Sep. 29, 2005, entitled “SYSTEMS AND METHODS FOR DETERMINING REAL-TIME PCR CYCLE THRESHOLDS USING A CLUSTER ANALYSIS,” which is hereby incorporated by reference in its entirety.BACKGROUND OF THE INVENTION[0002]The present invention relates generally to systems and methods for processing data representing sigmoid type curves or growth curves, and more particularly to systems and methods for determining characteristic cycle threshold (Ct) or elbow values in real-time PCR amplification curves.[0003]The Polymerase Chain Reaction (PCR) is an in vitro method for enzymatically synthesizing or amplifying defined nucleic acid sequences. The reaction typically uses two oligonucleotide primers that hybridize to opposite strands and flank a template or target DNA sequence that is to be amplified. Elongation of the primers is catalyzed by a heat-stable...

Claims


Application Information

Patent Timeline
Patent Type & Authority Patents(United States)
IPC IPC(8): G06F19/00G01N33/48
CPCG06K9/0053C12Q1/6851G06F17/10G06F2218/10
Inventor KURNIK, RONALD T.
Owner ROCHE MOLECULAR SYST INC
Why Eureka
Try Eureka