System and method for creating a stable optical interface

a technology of optical interface and stable structure, applied in the field of stabilizing an optical interface, can solve the problems of low level of compliance, serious medical complications, low compliance, etc., and achieve the effects of optimizing improving the interface, and reducing the optical coupling efficiency of the sensor

Active Publication Date: 2012-07-10
MASIMO CORP
View PDF284 Cites 463 Cited by
  • Summary
  • Abstract
  • Description
  • Claims
  • Application Information

AI Technical Summary

Benefits of technology

[0035]The coherence length of the optical sensor system, which is a measure of the depth resolution of the system, is broadly inversely related to the bandwidth of the optical source of the system, such as, for example, a superluminescent diode. Thus, as the bandwidth of the optical source increases, the coherence length of the system decreases, and accordingly, the depth resolution of the system improves. The interface between the optical sensor and the skin has a specific peak intensity value, for example, 60 dB, and the width of the peak is the coherence length of the optical sensor system, for example, 30 microns. However, for each depth scan, the optical sensor / skin interface peak doesn't always occur at the exact location in depth, i.e., the peak location may be offset by a few microns in depth. If, for example, the threshold trigger is set to a value that is near the signal peak intensity value, then the offset of the location of each peak value for each depth scan cannot be more than a fraction of the coherence length, which is below the resolution of the optical system. Thus, the offset does not affect the data collected by the sensor and the depth scans may be averaged to reduce speckle and to produce an accurate sensor reading.
[0044]Additionally, the index matching medium smoothes out the relatively rough surface of the skin, which may cause a scattering of the focused beam at the skin surface. Accordingly, the index matching medium coats the skin and reduces the optical roughness of the skin surface, thereby optimizing the intensity of the light that goes into and comes out of the skin.

Problems solved by technology

But the inconvenience of this procedure—specifically the blood extraction and the use and disposition of test strips—has led to a low level of compliance.
Such low compliance can lead to serious medical complications.
Despite significant efforts, these techniques have shortcomings such as low sensitivity, low accuracy (less than current invasive home monitors) and insufficient specificity of glucose concentration measurement within the relevant physiological range (4-30 mM or 72-540 mg / dL).
One drawback associated with using OCT for monitoring blood glucose is the signal noise associated with optical interferometry, also known as speckle.
As discussed below, there are multiple problems associated with providing and maintaining a stable and reproducible optical interface between an OCT sensor and the skin of a patient.
While both sensor designs provide mechanisms for incorporating OCT into a noninvasive blood glucose sensor, there are several drawbacks associated with the above designs as described below.
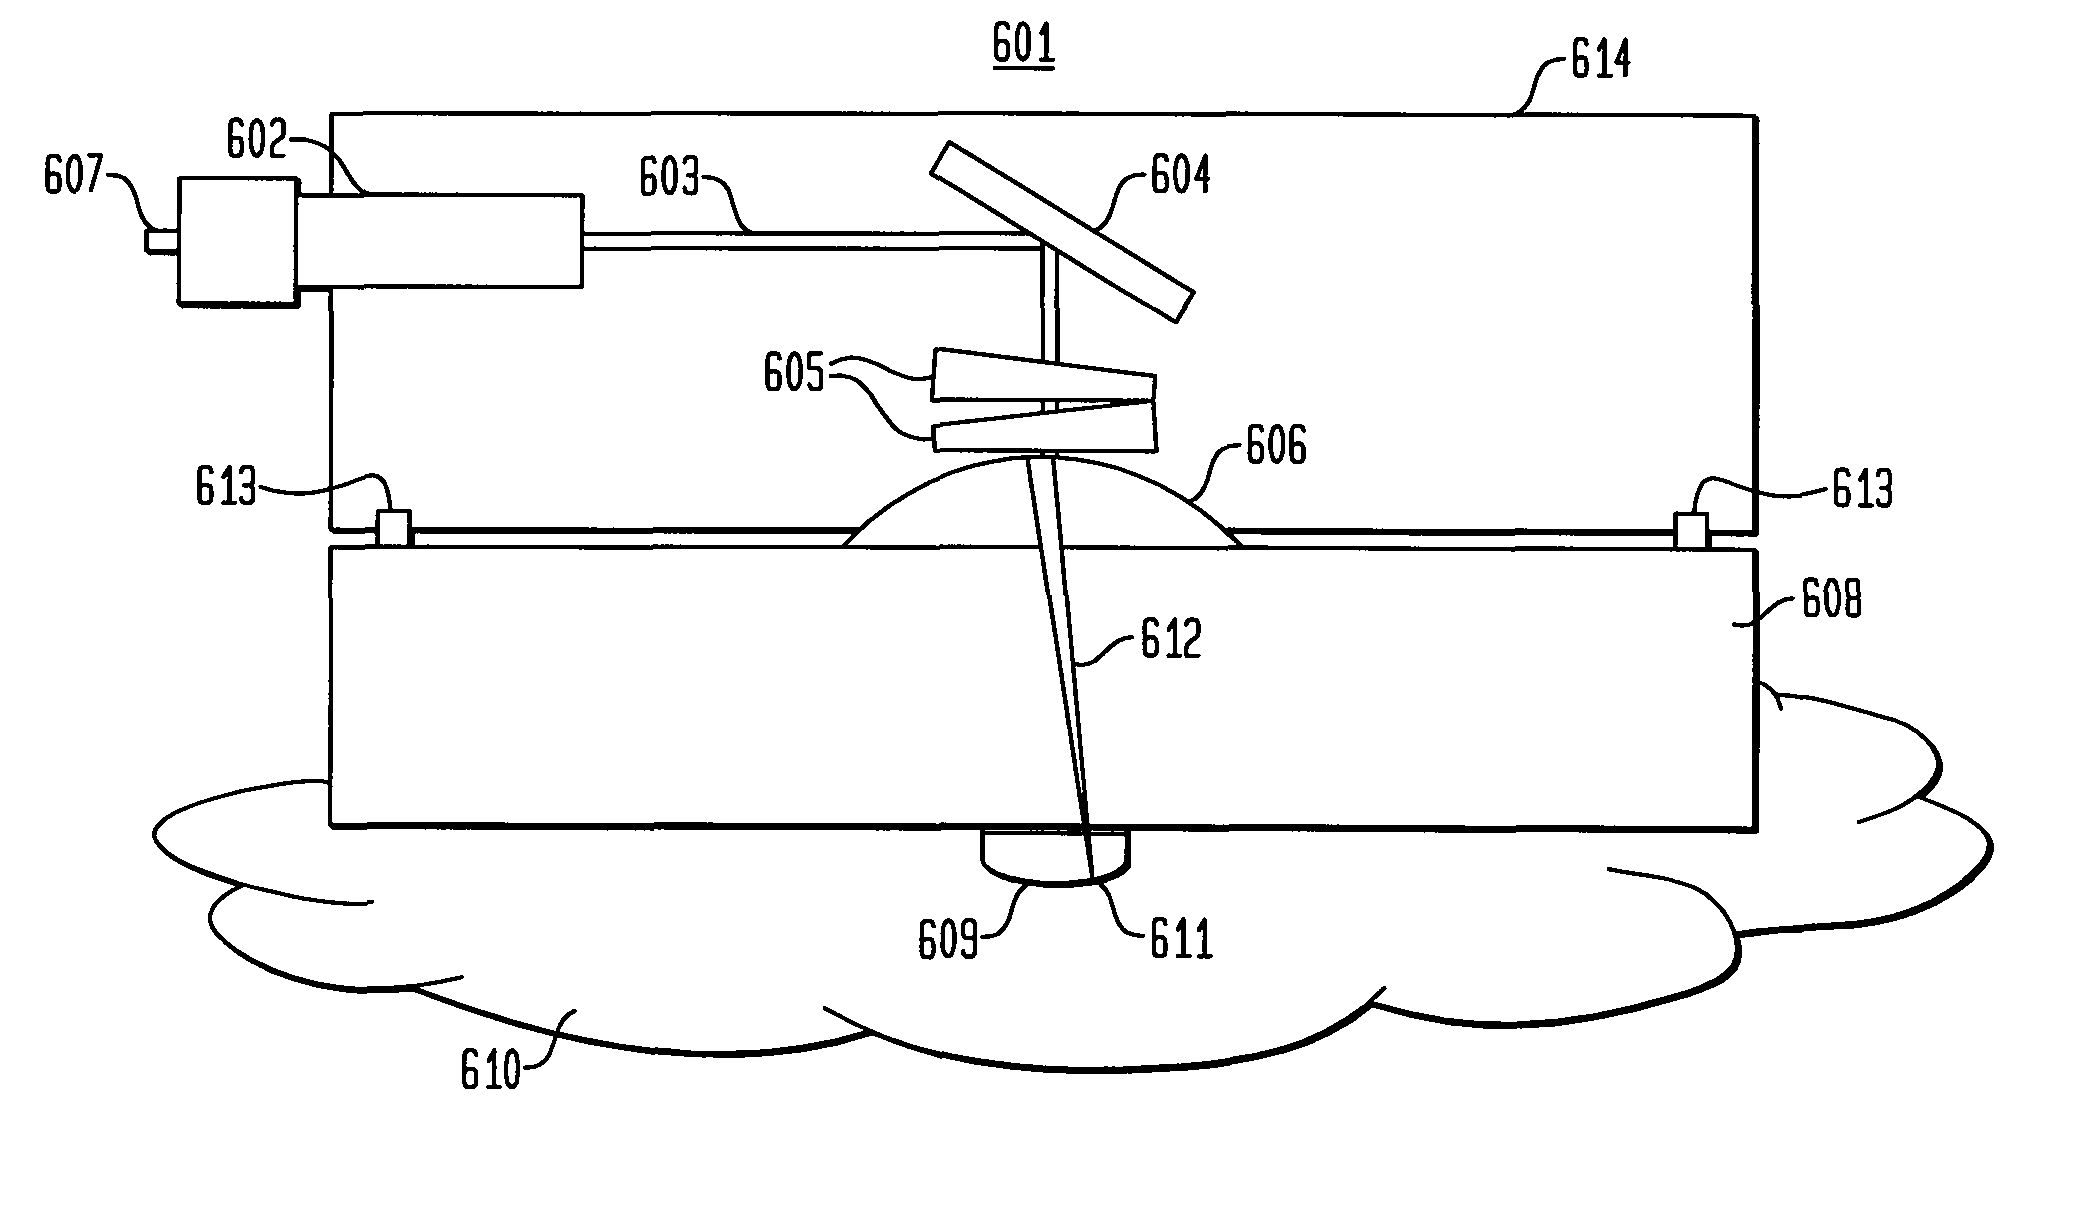
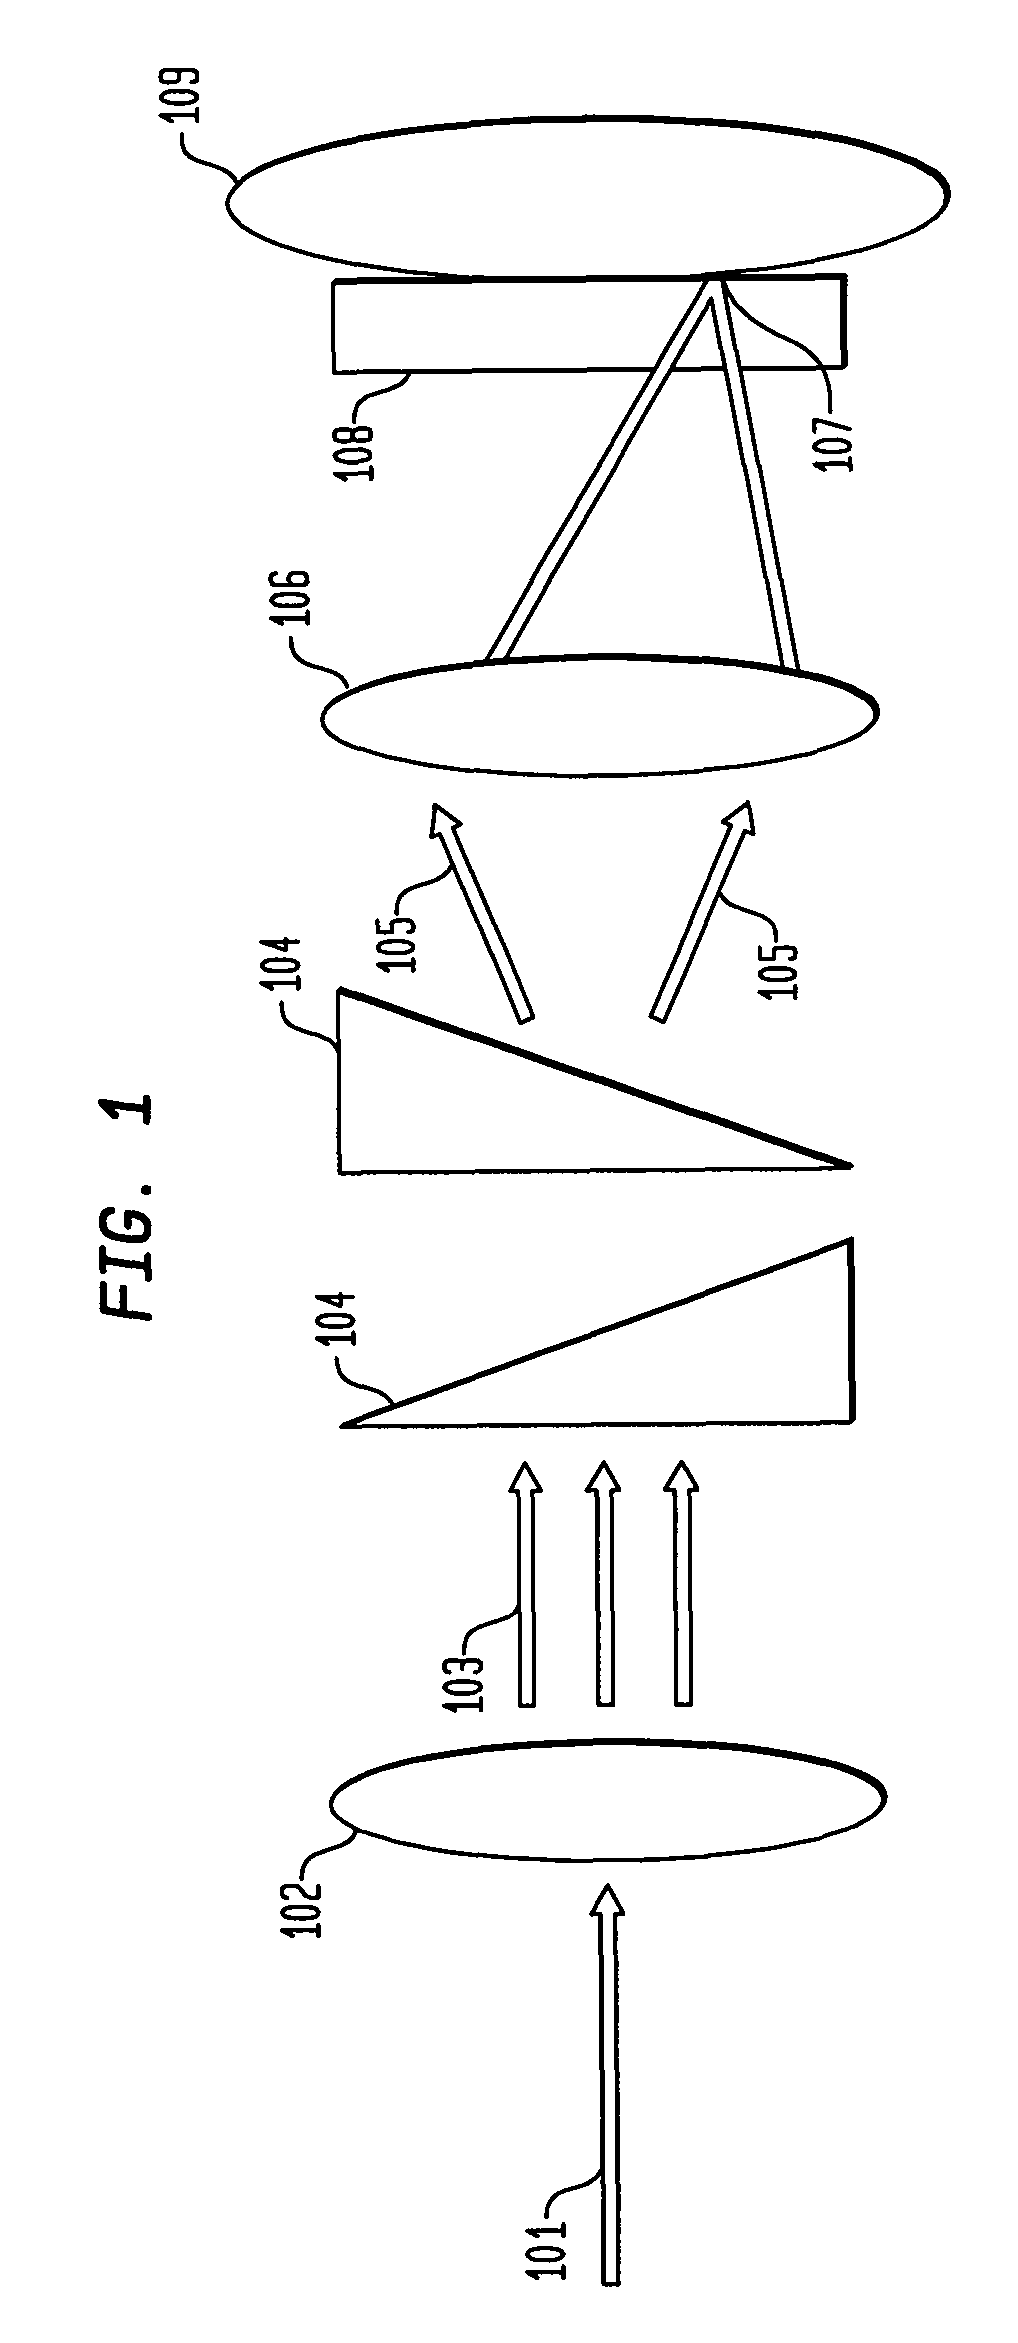
One drawback associated with the dual wedge prism sensor design of FIG. 1 is illustrated in FIG. 3.
Another drawback associated with the dual wedge prism sensor is the distortion of the scan along the depth axis or z-axis of the light beam entering and exiting the skin.
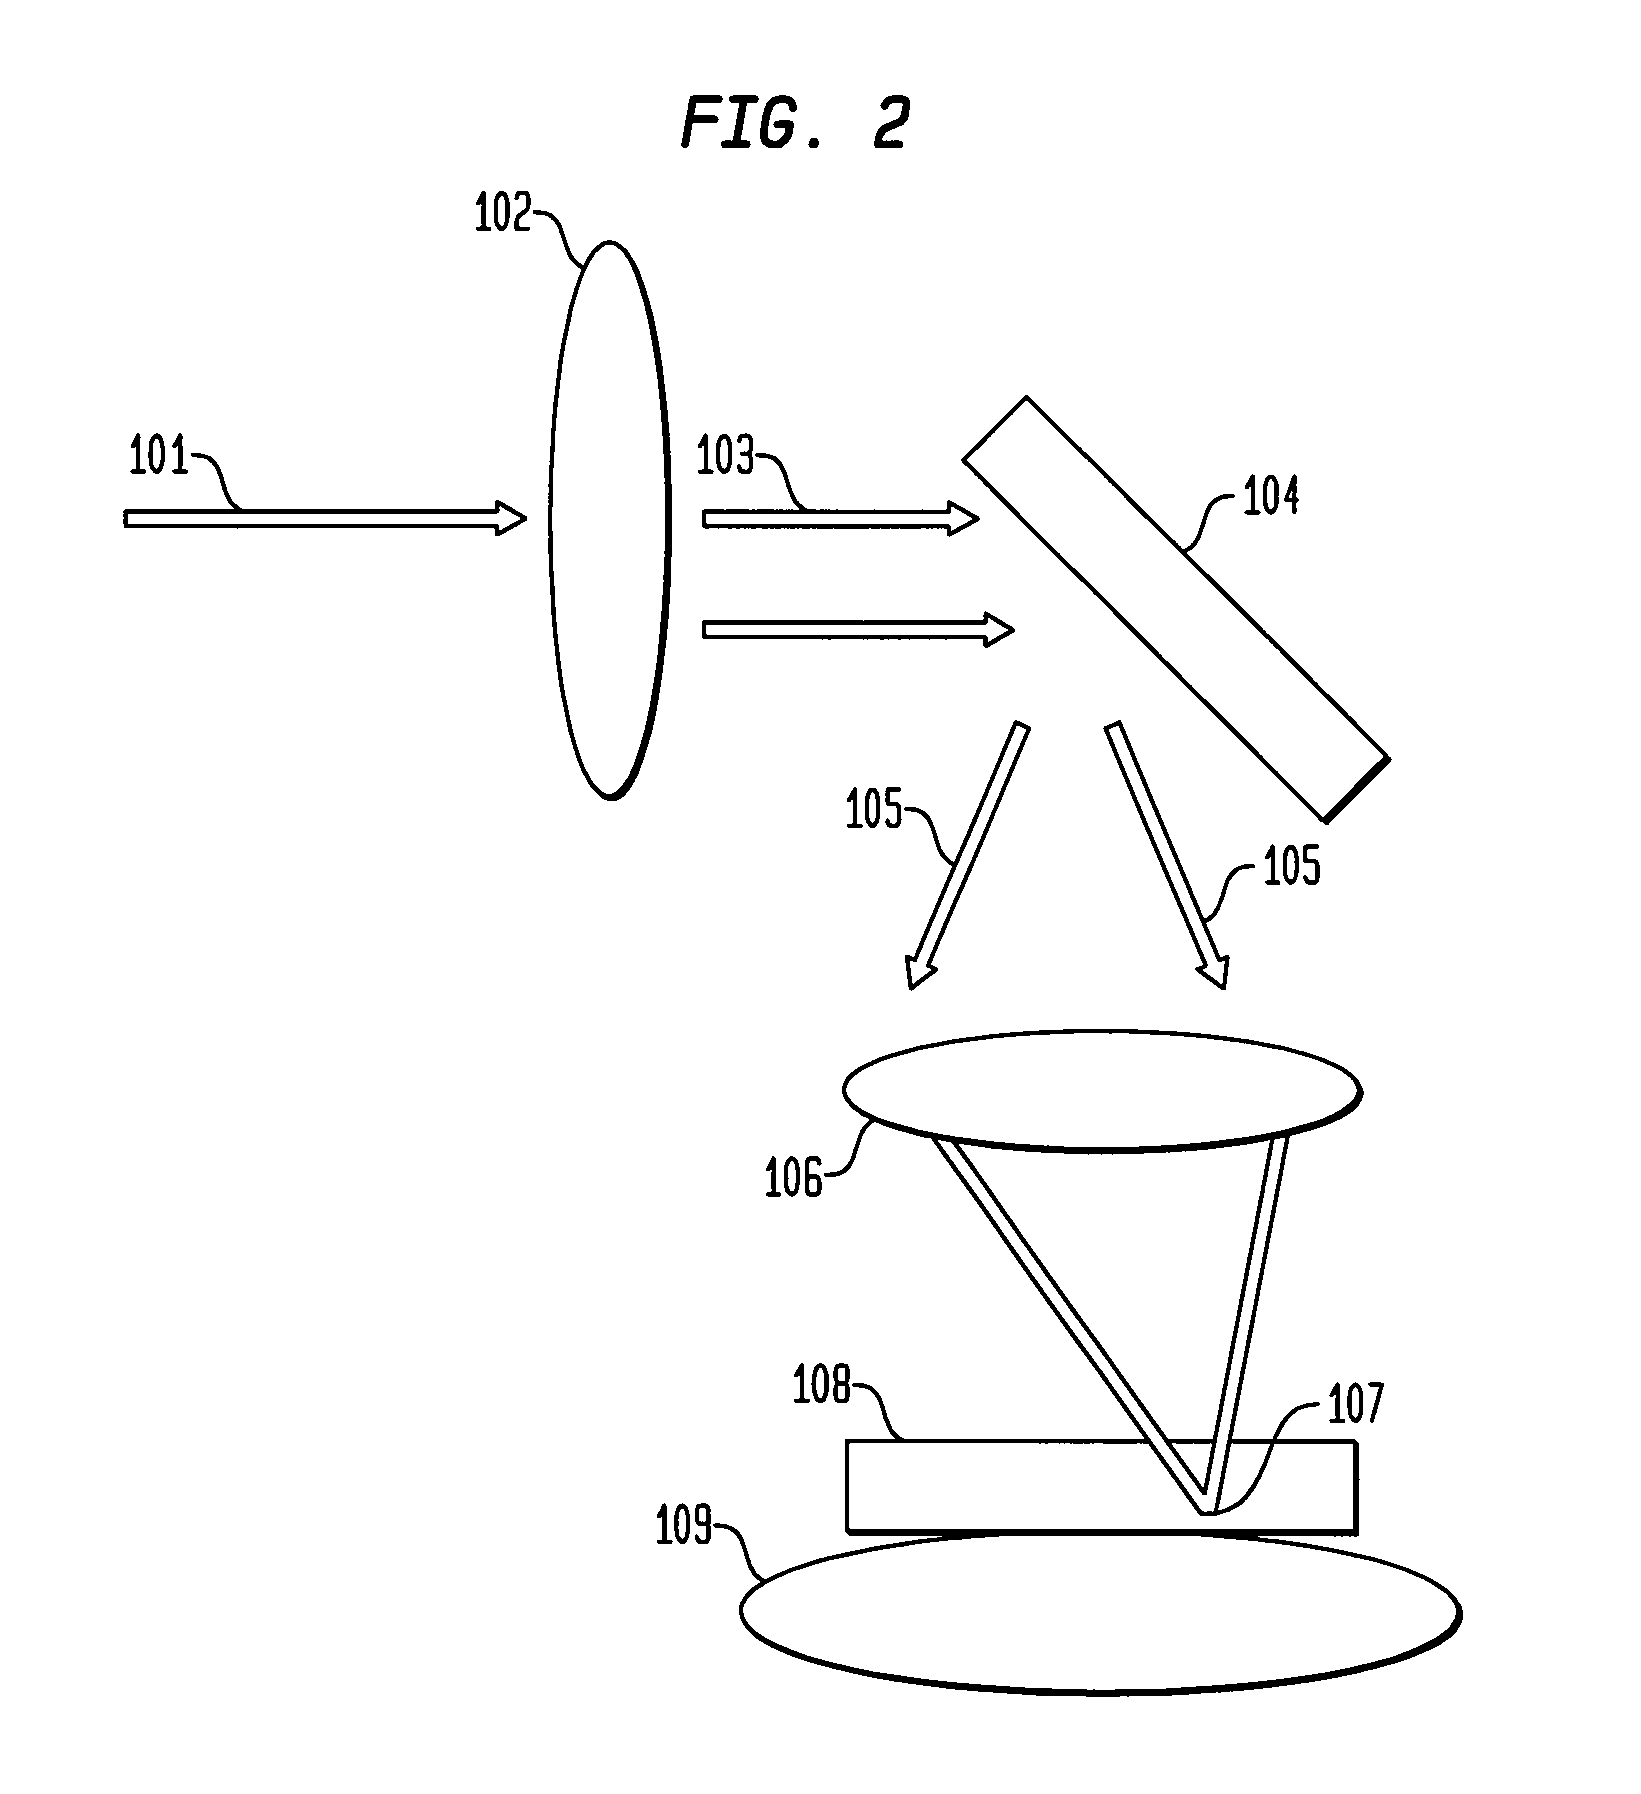
However, a problem associated with the dual wedge prism sensor in FIG. 1 and the oscillating mirror sensor in FIG. 2 is the inability to capture each depth scan position due to the angular velocity of the wedge prism(s) 104 or the oscillation rate of the angled mirror 201 being harmonic in phase with the depth scan rate of the optical sensor, i.e., the frequency of the angular velocity is a multiple or integral of the depth scan rate of the sensor.
However, if the angular velocity is an integral or harmonic of the depth scan rate, the depths scans begin to overlap in location, thereby producing an incomplete circle pattern and a loss of spatially independent depth scans, as shown in FIG. 4A.
With an overlap of depth scans, the same locations of tissue are scanned, causing less speckle reduction and poor imaging of structures within the scanned tissue.
Another challenge presented by both the wedge prism design in FIG. 1 and the oscillating mirror design in FIG. 2 is the inability to maintain the focal point 107 of the focused collimated beam on the focal plane, or the interface between the optical window 108 and the surface area of the skin 109 being scanned.
Additionally, the depth scale of the focused light is affected such that the displacement of the focal point 107 off of the focal plane results in an equivalent loss in the depth scale of the signal.
This results in a blurring of the optical axis, causing measurable details within the skin to be blurred or washed out.
Thus, a displacement of the focal point off the focal plane results in a reduction in the sensor signal intensity and a blurring of the optical axis.
Additionally, optical lenses are not perfect.
As discussed above, when the focal point 107 is no longer on the focal plane, the collection efficiency of the light drops, resulting in the collected data incorrectly indicating a reduction in power.
This, in turn, alters the depth of the focused beam, thereby unwittingly washing out details in the skin and lowering the resolution and integrity of the scan.
This mismatch of refractive indices and, in addition, the space between the skin 504 and the optical window 503 due to the optical roughness 505 reduces the reliability of data taken by the sensor.
Unfortunately, these changes in signal intensity over this extended period of time may completely mask the changes that are occurring along the OCT signal, and thus prevent proper correlation of changes in the OCT signal to changing glucose levels, as discussed in U.S. Provisional Applications Nos. 60 / 671,007 and 60 / 671,285, both entitled “Method For Data Reduction and Calibration of an OCT-Based Blood Glucose Monitor.” Thus, multiple scans taken over time cannot produce a reliable measurement from the same lateral location on the skin.
In addition, a patient would be required to place the sensor onto his or her skin and wait 60-90 minutes before using it, in order to receive reliable and reproducible results, which creates an inefficient sensor.

Method used


Image

  • System and method for creating a stable optical interface
  • System and method for creating a stable optical interface
  • System and method for creating a stable optical interface

Examples


Embodiment Construction

[0061]FIG. 6A presents an optical scanning apparatus system or sensor system for taking blood glucose measurements, according to an embodiment of the present invention. Specifically, the sensor system in FIG. 6A includes a dual wedge prism sensor housing 616 attached to a disposable optical lens apparatus 608 with a Petzval surface 609. In FIG. 6A, sensor system 601 comprises a sensor housing 614 that includes a collimator 602 connected to a light source at a connector 607, wherein the light source produces a collimated light 603. An example of a connector is a fiber-optic cable. The collimated light 603 hits a fixed mirror 604, which bends the collimated light 603 to a ninety degree angle. The collimated light 603 passes through rotating dual wedge prisms 605 that deviate the angle of collimated light 603 off the optical axis of the sensor 601. The amount of deviation is based on the thickness of each wedge prism 605 that the collimated light 603 passes through as the wedge prisms ...


PUM


Abstract

A system and a method for creating a stable and reproducible interface of an optical sensor system for measuring blood glucose levels in biological tissue include a dual wedge prism sensor attached to a disposable optic that comprises a focusing lens and an optical window. The disposable optic adheres to the skin to allow a patient to take multiple readings or scans at the same location. The disposable optic includes a Petzval surface placed flush against the skin to maintain the focal point of the optical beam on the surface of the skin. Additionally, the integrity of the sensor signal is maximized by varying the rotation rates of the dual wedge prisms over time in relation to the depth scan rate of the sensor. Optimally, a medium may be injected between the disposable and the skin to match the respective refractive indices and optimize the signal collection of the sensor.

Description

BACKGROUND OF THE INVENTION[0001]1. Field of the Invention[0002]The present invention relates generally to stabilizing an optical interface and, more specifically, to creating a reproducible and stable optical interface between biological tissue and an optical blood glucose sensor.[0003]2. Related Art[0004]Monitoring of blood glucose concentration levels has long been critical to the treatment of diabetes in humans. Current blood glucose monitors involve a chemical reaction between blood serum and a test strip, requiring an invasive extraction of blood via a lancet or pinprick. Small handheld monitors have been developed to enable a patient to perform this procedure anywhere, at any time. But the inconvenience of this procedure—specifically the blood extraction and the use and disposition of test strips—has led to a low level of compliance. Such low compliance can lead to serious medical complications. Thus, a non-invasive method for monitoring blood glucose is needed.[0005]Studies ...

Claims


Application Information

Patent Timeline
Patent Type & Authority Patents(United States)
IPC IPC(8): A61B5/1455
CPCA61B5/0066A61B5/14532A61B5/6833A61B5/1455A61B2562/146A61B5/6832
Inventor SCHURMAN, MATTHEW J.WALLACE, PHILLIP WILLIAMSHAKESPEARE, WALTER J.APPLE, HOWARD P.BENNETT, WILLIAM HENRY
Owner MASIMO CORP
Why Eureka
Try Eureka