

Methods and devices for measuring the concentration of an additive
a technology of additive concentration and monitoring device, which is applied in the direction of instruments, other chemical processes, separation processes, etc., can solve the problems of increasing or reducing the demand, determining the concentration of a low amount of ferrate in a treatment stream, and many analytical methods that exist today cannot accurately measure the strength of ferrate, so as to increase or decrease the demand for ferrate
- Summary
- Abstract
- Description
- Claims
- Application Information
AI Technical Summary
Benefits of technology
Problems solved by technology
Method used
Image

Examples
example 1
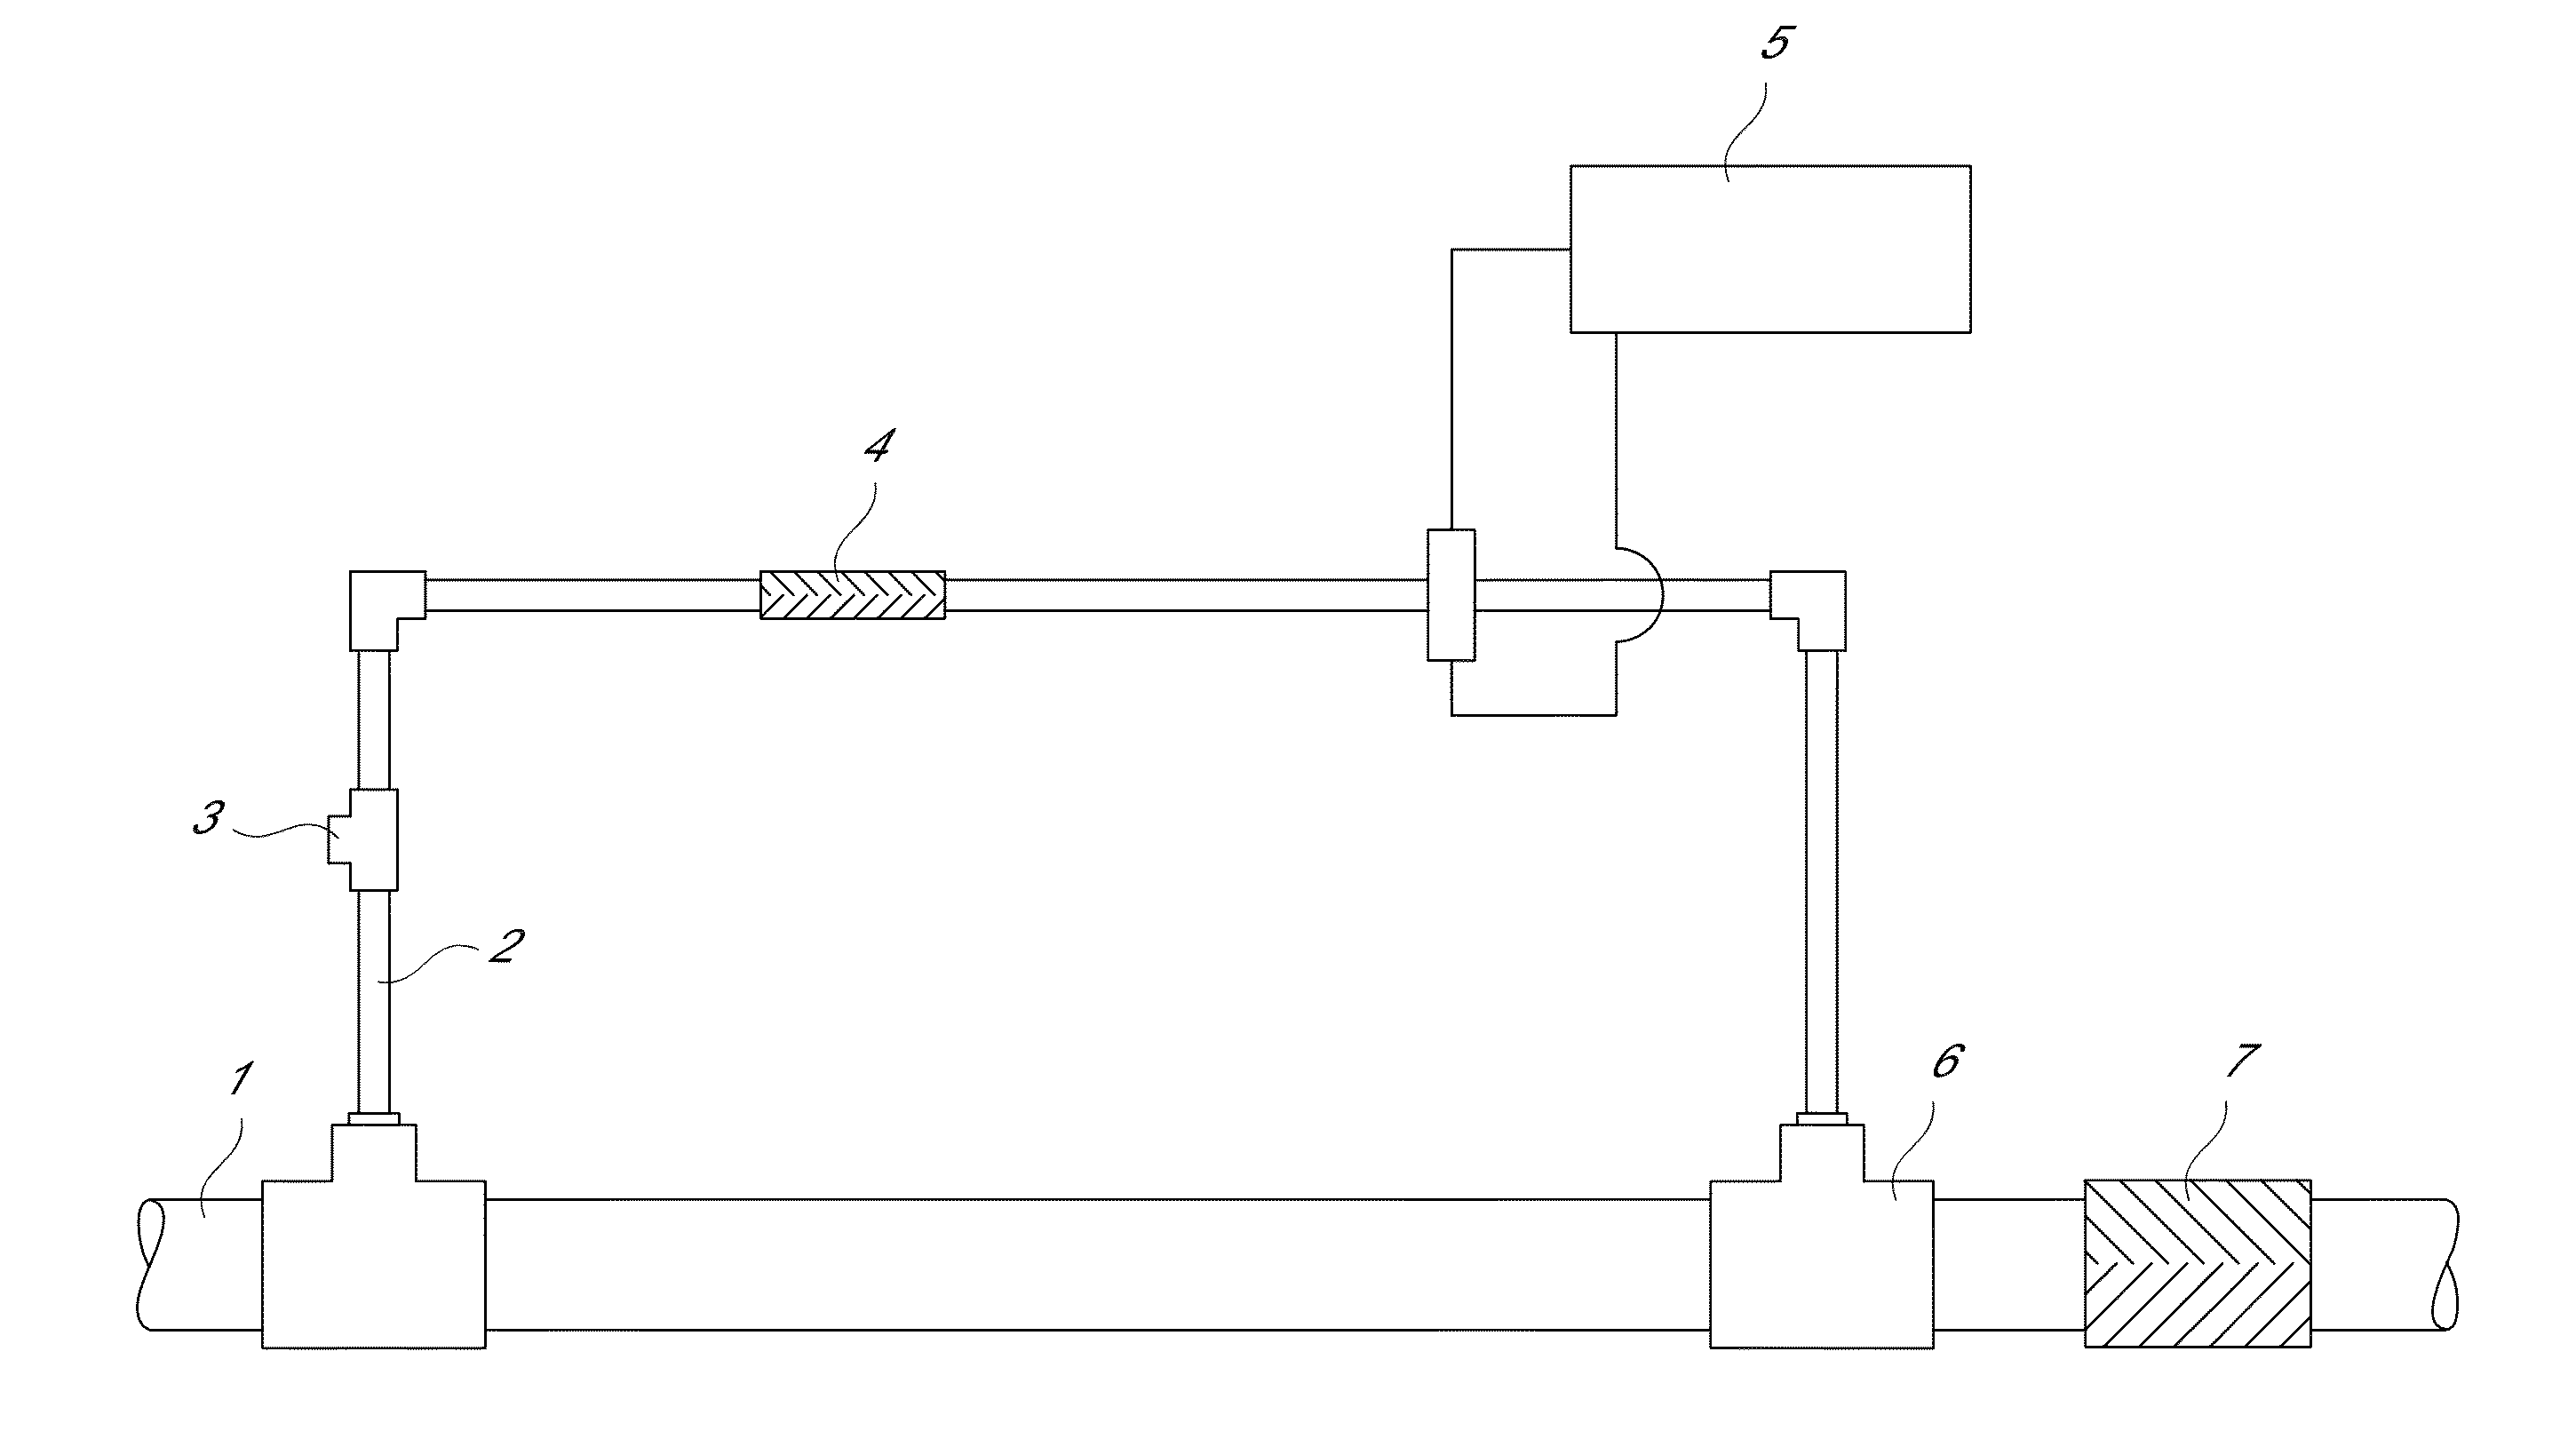
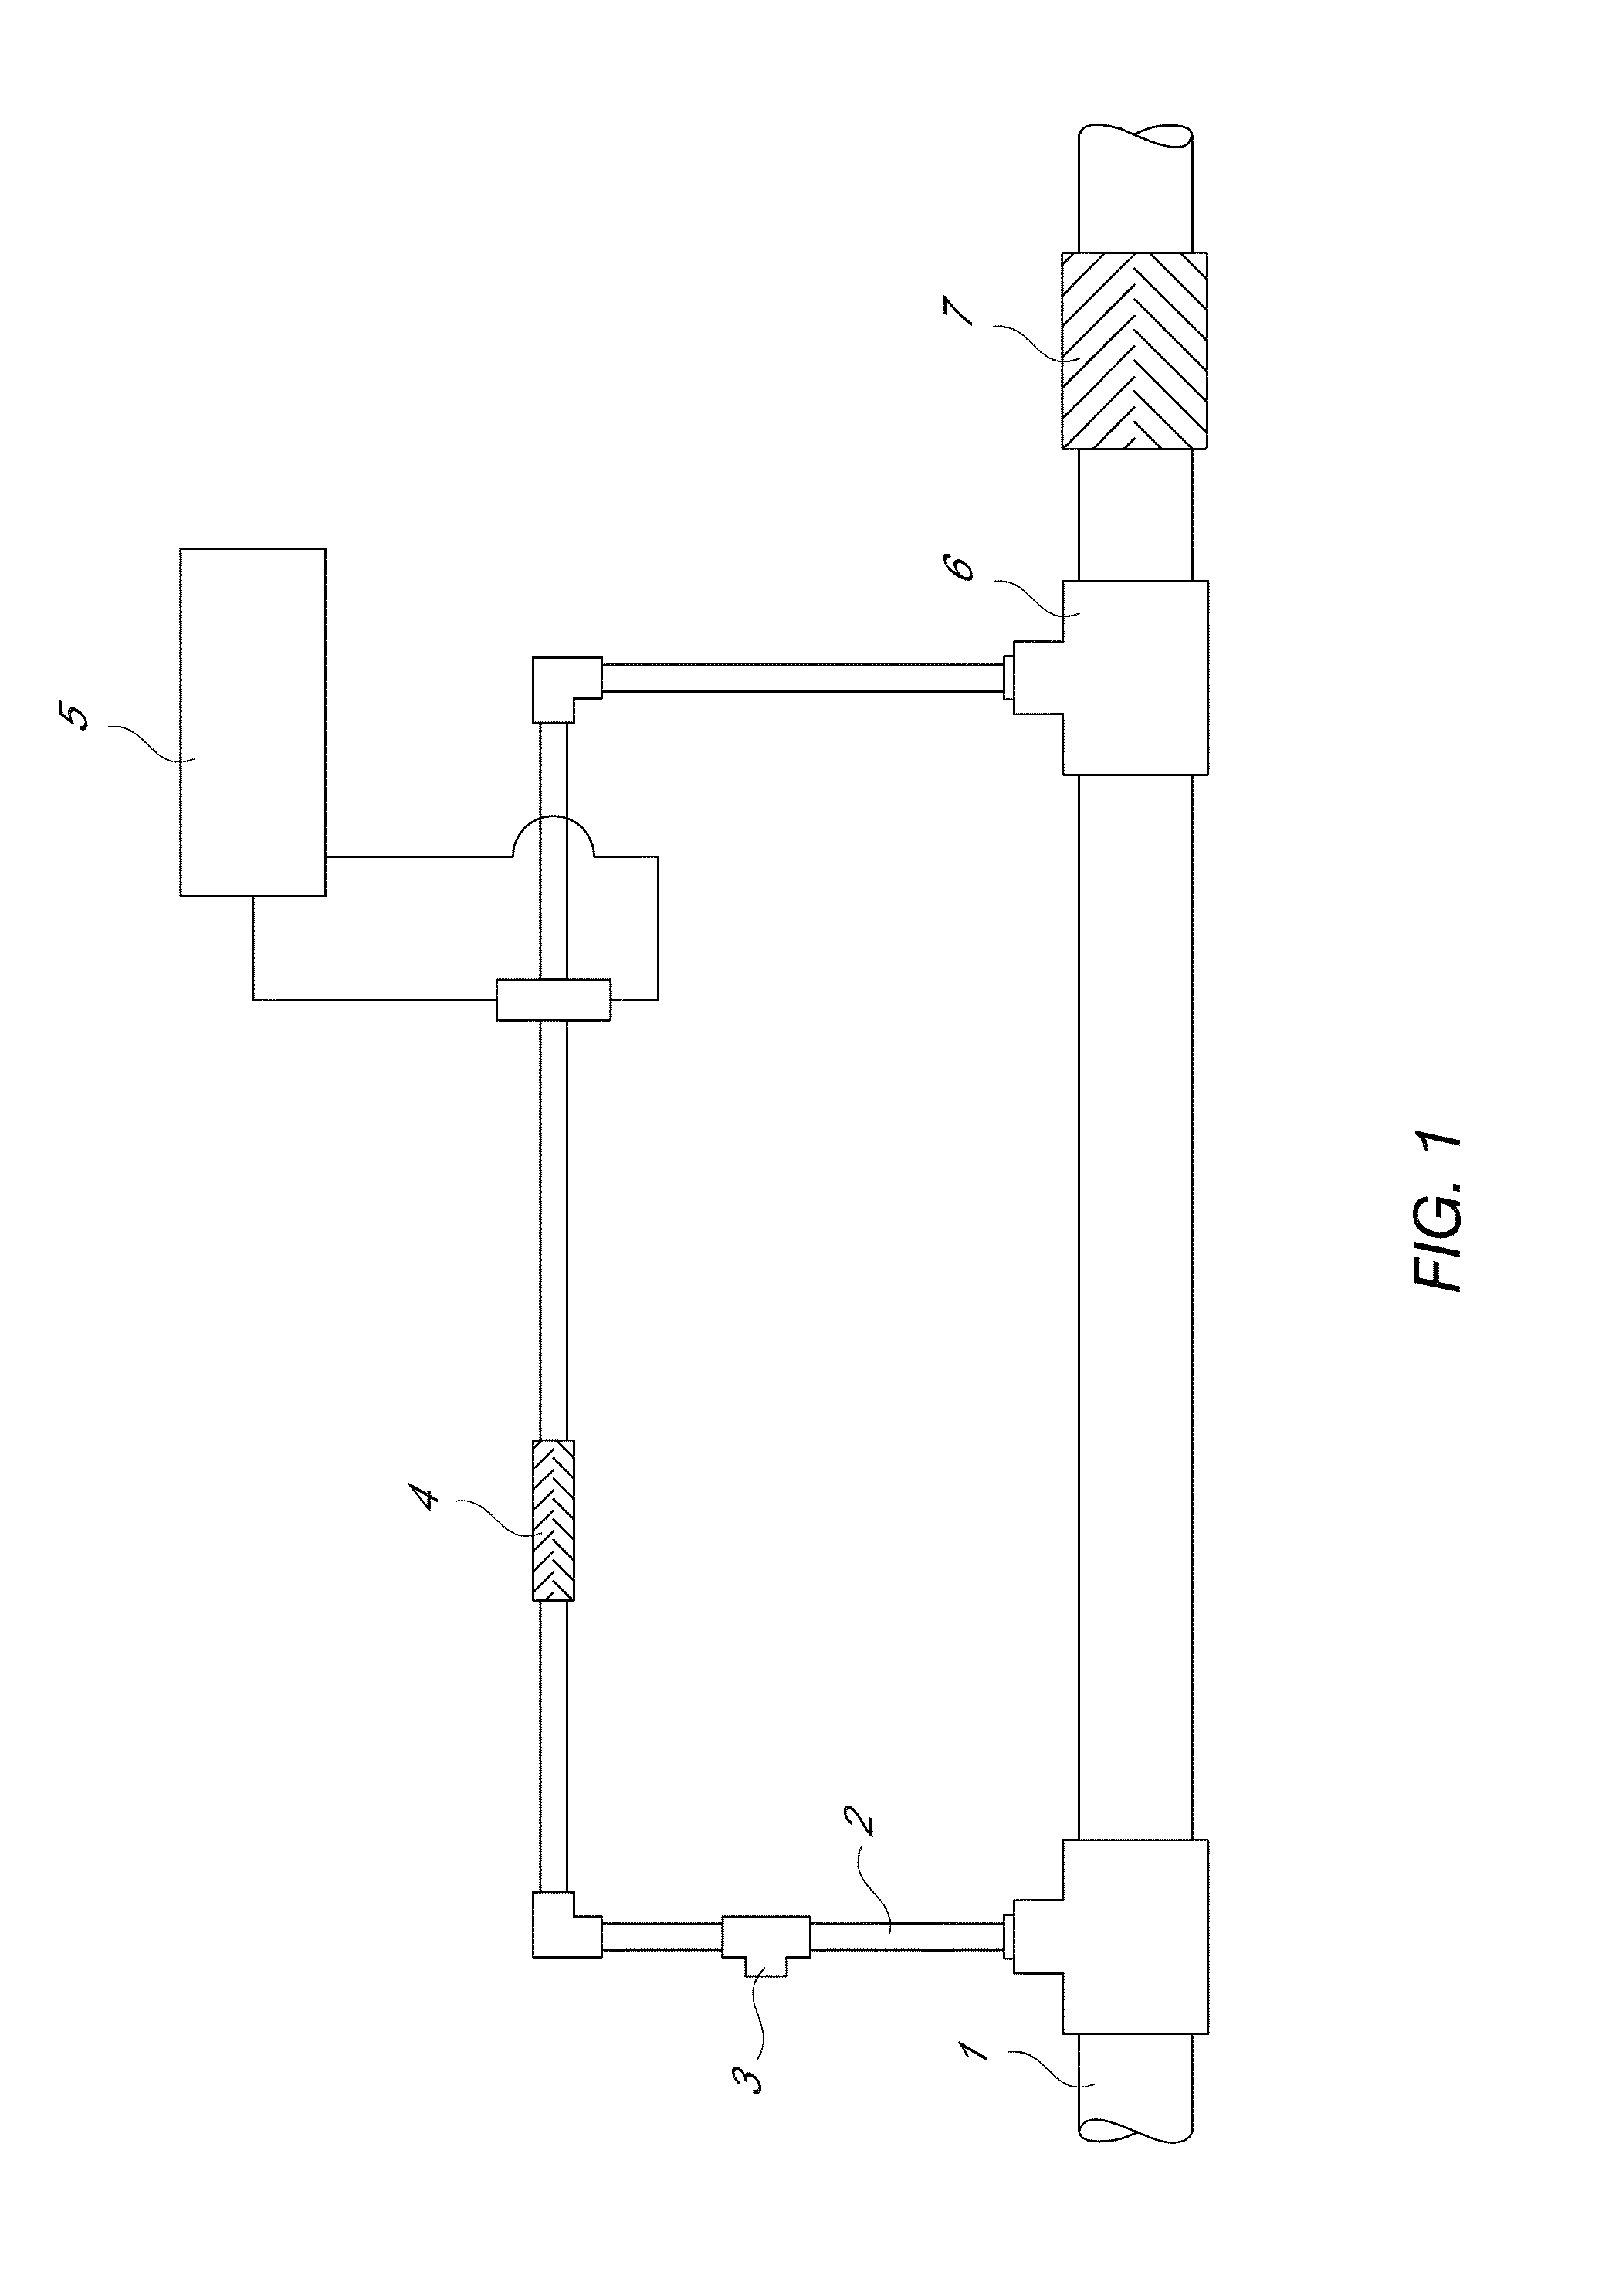
[0115]The following is one embodiment of a laboratory procedure for indirectly measuring ferrate concentration in a treatment stream. A dosing stream was made and the volumetric flow rate ratio of the treatment stream to the dosing stream was 25:1. Doses of ferrate in the amounts of approximately 250, 125, 62.5, 30, and 12.5 ppm were administered to the dosing stream. When rejoined to the full treatment stream, the concentration of the ferrate would be calculated to be 10, 5, 2.5, 1.2, and 0.5 ppm, respectively. Ferrate was synthesized and then diluted in a high pH buffer (to preserve ferrate strength) of a known volume. The diluted ferrate solution was then poured into a capped monitor flow cell. The monitor was then calibrated to the known concentration (ppm) of the diluted solution and verified with an analytical control. The flow cell was rinsed out with a buffer solution. Then, various doses of dilute ferrate were introduced into the monitor flow cell and then verified again wi...
example 2
[0117]A treatment stream and a dosing stream were designed having a volumetric flow rate of about 25:1. Doses of ferrate were added to the dosing stream in amounts of approximately 12.5, 25, 37.5, and 50 ppm. In the full treatment stream, this would result in calculated doses of 0.5, 1, 1.5, 2 ppm. The experiment was conducted in a similar manner as the first example. Each dose of ferrate was diluted in buffer and introduced into the monitor flow cell and then verified with the analytical control. This was done three times for each dilution. The results are shown in Table 2 and FIG. 3.
[0118]
TABLE 2DosingTreatmentTreatmentDosingstreamstreamstreamstreamexperimentaltheoreticalexperimentaltheoretical(PPM, average of 3calculationcalculation(PPM)measurements)(PPM)(PPM)12.5150.50.62526.711.137.534.71.51.4504621.8
PUM
| Property | Measurement | Unit |
|---|---|---|
| wavelength | aaaaa | aaaaa |
| wavelength | aaaaa | aaaaa |
| wavelength | aaaaa | aaaaa |
Abstract
Description
Claims
Application Information