
Method for graph based processing of signals

a signal and graph processing technology, applied in the field of signal processing, can solve the problems of high complexity of methods, unsuitable for a variety of given signals, and high degree of sensitiveness of filtering results, and achieve the effect of improving the peak signal-to-noise ratio

Inactive Publication Date: 2017-03-21
MITSUBISHI ELECTRIC RES LAB INC
View PDF6 Cites 0 Cited by
  • Summary
  • Abstract
  • Description
  • Claims
  • Application Information

AI Technical Summary

Benefits of technology

[0023]In one particular embodiment, the subspace is defined as a Krylov subspace of a graph Laplacian, which is advantageous because it allows us to determine a polynomial-based filter.
[0029]Alternatively, or additionally, the function of the graph matrix can be based on an iterative method solving a partial eigenvalue problem for the graph matrix, wherein the partial eigenvalue problem is a problem of computing a part of eigenvalues, and the number of iterations of the iterative method is determined by a threshold. This embodiment is based on realization that limiting the number of iterations of the iterative method solving a partial eigenvalue problem allows the user to control both the filter quality and the computational costs. For example, for the purpose of low pass filtering, one can target the low band in the spectrum. If the number of iterations is too large, then the filter method not only is computationally expensive, but also restricts the filtering specifically to the selected target, decreasing the filter quality.

Problems solved by technology

However, those methods suffer from high complexity due to the requirement of determining a full eigenvalue decomposition of very high dimensional data.
This approach has a disadvantage that the outcome of the filtering is highly sensitive to the choice of the regularization parameter.
That approach restricts the filtering process to a predetermined fixed function, which may not be the best suitable for a variety of given signals.

Method used


Image

  • Method for graph based processing of signals
  • Method for graph based processing of signals
  • Method for graph based processing of signals

Examples


Embodiment Construction

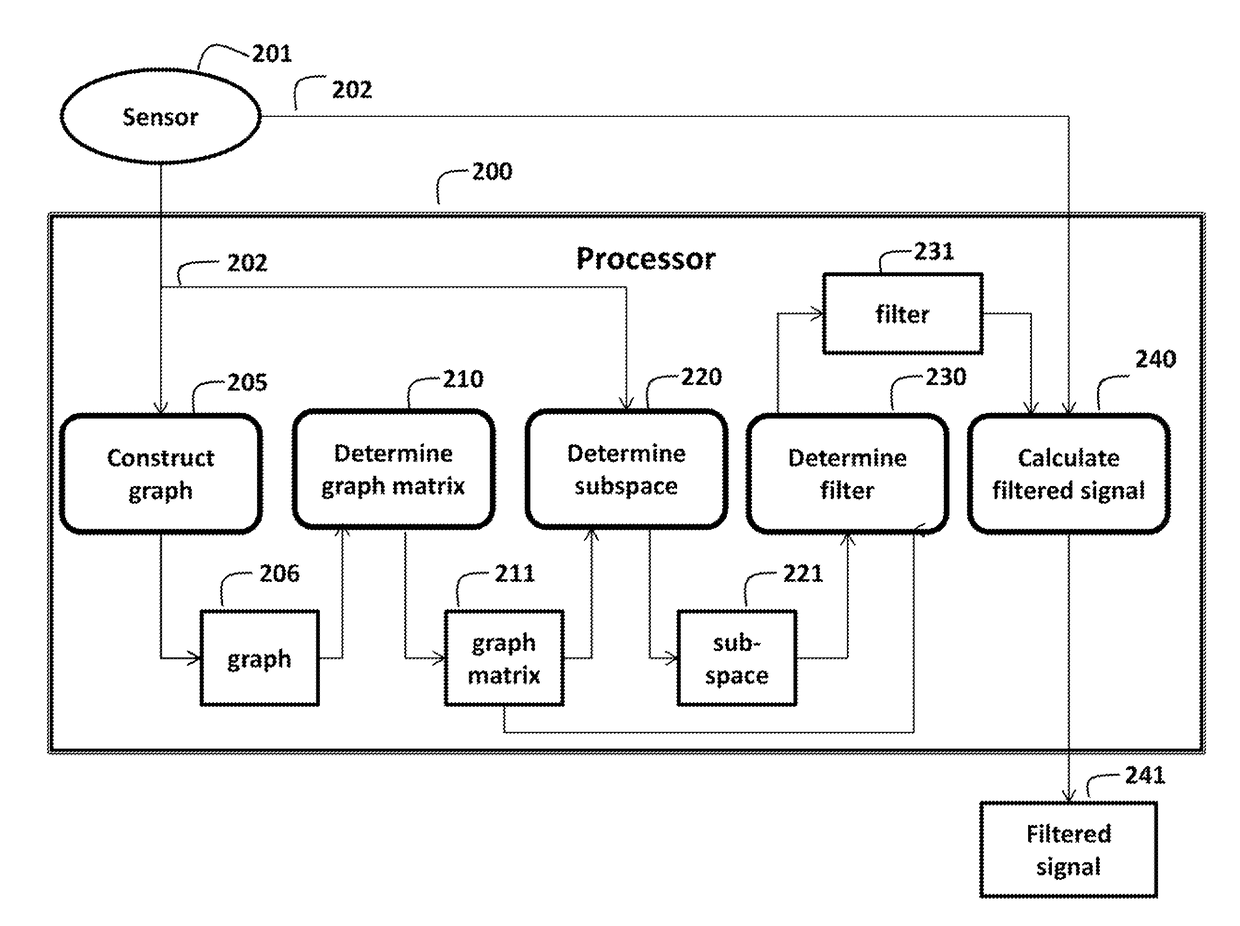
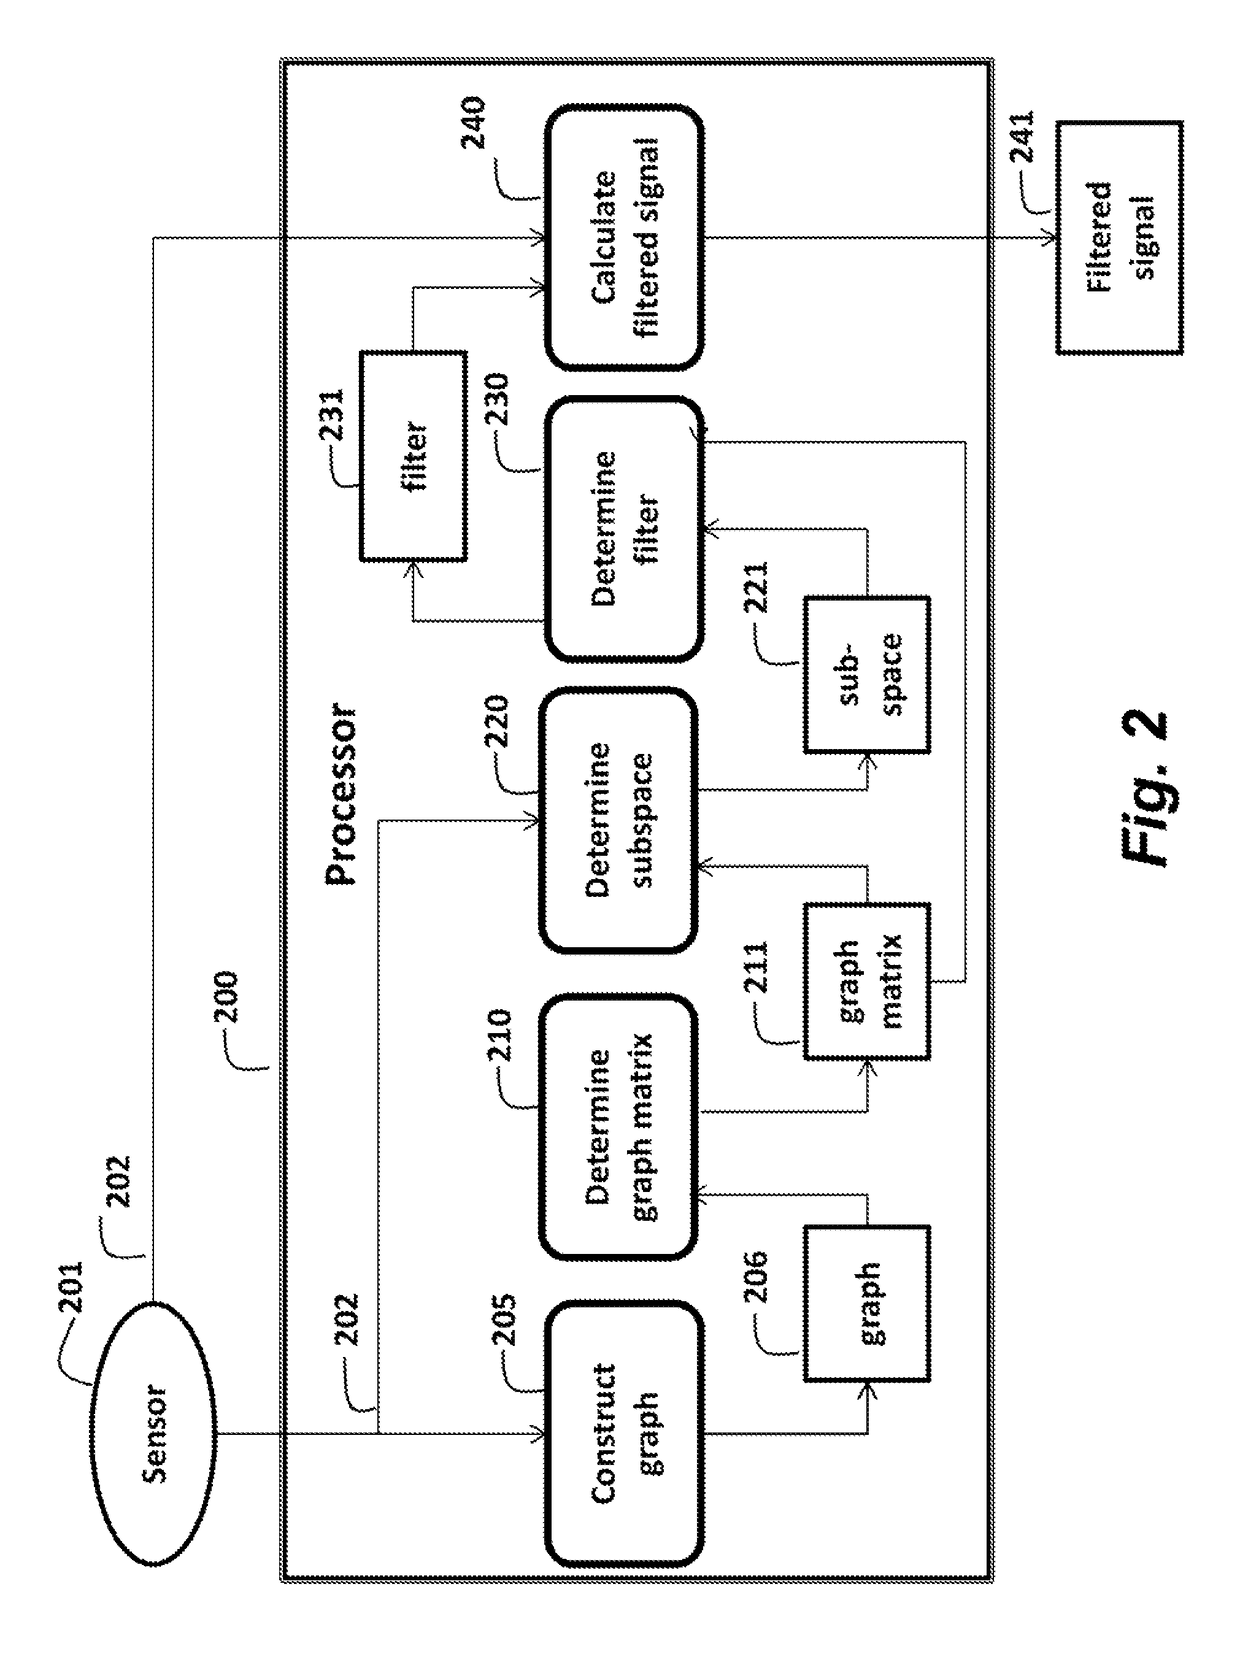
[0043]FIG. 2 shows a flow chart of a method for processing a signal 202. The signal 202 can be acquired by a sensor 201. For example, the sensor is a camera or a 3D video camera. Alternatively, the signal is stored in a memory. Typically, the signal is in the form of digital (binary) data. A graph 206 is constructed 205 from the signal. A graph matrix 211 is determined 210 from the graph. A subspace 221 is determined 220 based on the graph matrix and the signal. A filter 231 to the subspace is determined 230. The filter 213 is a map that maps 240 the signal 202 to the subspace 221 producing the filtered out signal 241.

[0044]FIG. 3 shows a flow chart for determining 220 the subspace from a group consisting of a Krylov subspace 305, an approximate Krylov subspace 310, a rational Krylov subspace 320, an approximate rational Krylov subspace 330, and combinations 340 thereof.

[0045]FIG. 4 shows a flow chart for determining 230 the filter 231 from a group consisting of a function 405 of th...


PUM


Abstract

A method processes a signal by first constructing a graph from the signal, and then determining a graph matrix from the graph and the signal. A Krylov-based subspace is determined based on the graph matrix and the signal. A filter for the Krylov subspace is determined. The filter transforms the signal to produce a filtered signal, which is output.

Description

FIELD OF THE INVENTION[0001]This invention relates generally to signal processing, and more particularly to denoising 2D images or video, as well as 3D images or video.BACKGROUND OF THE INVENTION[0002]A wide range of applications in signal processing exhibits data that can be represented on vertices of graphs that describe a geometric structure of the data. These applications include social, energy, transportation and sensor networks, as well as synthetic and natural images, videos, and medical and hyper-spectral images.[0003]One particular application is 3D video signal processing, where images often have different quality levels due to various acquisition and compression techniques applied to source signals. For example, changes of brightness or color can be produced by imaging sensors and circuitry of stereo cameras, or from shot noise. Conventional image enhancement techniques can be used to improve the quality of the images. Since depth map compression has become an integral pa...

Claims


Application Information

Patent Timeline
Patent Type & Authority Patents(United States)
IPC IPC(8): G06T5/00G06T11/20
CPCG06T5/002G06T11/206G06T2207/20072
Inventor TIAN, DONGMANSOUR, HASSANKNIAZEV, ANDREIVETRO, ANTHONY
Owner MITSUBISHI ELECTRIC RES LAB INC
Learn More