Method for quantitative spectrometry, quantitative spectrometry apparatus, and program

a quantitative spectrometry and apparatus technology, applied in the direction of fluorescence/phosphorescence, analysis by material excitation, instruments, etc., can solve the problems of a large amount of work, a comparatively long time, and the drawback of existing standard addition methods, which is typically difficult to apply when the sample is large, and achieves the effect of effective us

Active Publication Date: 2017-10-17
SPECTROSCOPIC SCI LAB
View PDF10 Cites 0 Cited by
  • Summary
  • Abstract
  • Description
  • Claims
  • Application Information

AI Technical Summary

Benefits of technology

[0011]According to the present invention, it is achievable to effectively use information obtained along the spectral axis as a result of spectrometry to determine an unknown composition ratio of a specific component in a mixture, regardless of whether it is a liquid, solid, or gas, while compensating for the drawbacks of existing standard addition methods. It is also achievable to simultaneously determine composition ratios of a plurality of components targeted for quantification by simultaneous generation and analysis of hypothetical addition spectra for the plurality of components targeted for quantification.

Problems solved by technology

However, existing standard addition methods (including the method described in PTL 1) are designed to add a component identical to the component targeted for quantification to the sample stepwise and to perform spectroscopic measurement and analysis each time the component is added to the sample, and thus have drawbacks of being labor-intensive and taking a comparatively long time.
The existing standard addition methods also have a drawback of being typically difficult to apply when the sample is a solid.

Method used


Image

  • Method for quantitative spectrometry, quantitative spectrometry apparatus, and program
  • Method for quantitative spectrometry, quantitative spectrometry apparatus, and program
  • Method for quantitative spectrometry, quantitative spectrometry apparatus, and program

Examples


example 1

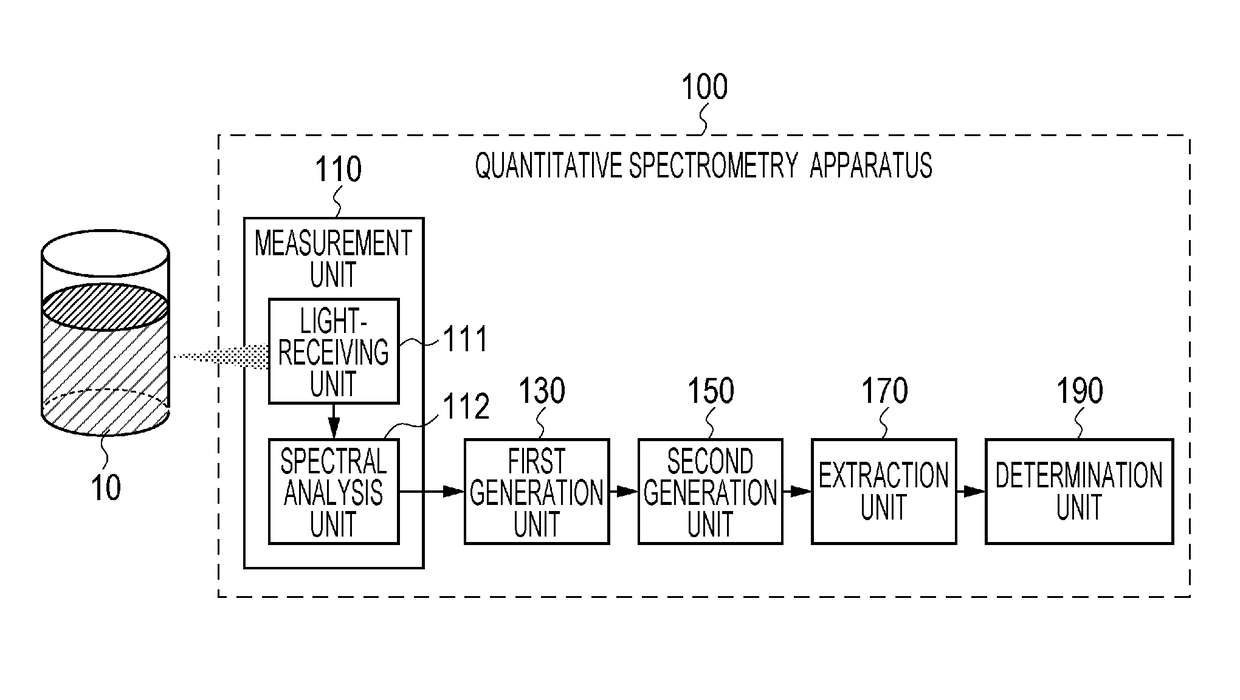
[0032]Example 1 of the present invention will be described with reference to FIGS. 1 to 10. FIG. 1 is a system diagram illustrating a configuration of a quantitative spectroscopic apparatus 100 according to Example 1 of the present invention. An analysis-target sample 10 is illustrated in the left part of FIG. 1. The analysis-target sample 10 is, for example, an aqueous mixed solution of glucose, sucrose, and fructose. Among them, in Example 1, glucose is assumed to be a component targeted for quantification whose composition ratio (concentration) is unknown. In order to assess the effect of Example 1 (a determination error of the unknown concentration based on the present invention), the analysis-target sample 10 is prepared with a glucose concentration true value of 1.05% and the following steps are performed assuming that the true value is unknown.

[0033]The quantitative spectroscopic apparatus 100 includes configuration elements within an area enclosed by a dashed line in FIG. 1....

example 2

[0068]Example 2 of the present invention will be described with reference to FIGS. 11 to 14. Example 2 provides enumeration of results of applying a method similar to that in Example 1 to a plurality of other types of mixtures (solutions) by using the same quantitative spectrometry apparatus 100 as that described in Example 1 to determine the concentrations of components targeted for quantification. In the following spectral diagrams, the vertical and horizontal axes correspond to those in FIGS. 5 to 8 and 10, except for the range of values.

[0069]FIG. 11 is a diagram illustrating results of analysis using an aqueous amino acid solution as an analysis-target sample (decomposition into a spectrum derived from a component targeted for quantification and a spectrum derived from a component not targeted for quantification). The respective line types representing the individual spectra are distinguishable in the same way as in FIG. 10. Components in the aqueous amino acid solution and the...

example 3

[0077]Example 3 of the present invention will be described with reference to FIGS. 15 and 16. Example 3 provides enumeration of results of applying a method similar to that in Example 1 to a plurality of other types of mixtures (solids or gases) by using the same quantitative spectrometry apparatus 100 as that described in Example 1 to determine the composition ratios of components targeted for quantification. In the following spectral diagrams, the vertical and horizontal axes correspond to those in FIGS. 5 to 8 and 10, except for the range of values.

[0078]FIG. 15 is a diagram illustrating results of analysis similar to those in FIG. 11 using a multivitamin tablet as an analysis-target sample. The respective line types representing the individual spectra are distinguishable in the same way as in FIGS. 10 and 11. The nominal value of the composition ratio of vitamin C, which was used as a component targeted for quantification, in the tablet is 80 mg per tablet (280 mg).

[0079]By cont...


PUM

PropertyMeasurementUnit
concentrationsaaaaaaaaaa

Abstract

A composition ratio of a component targeted for quantification in a liquid, solid, or gaseous mixture is determined without taking the effort of performing measurement while stepwise changing an addition concentration as in an existing standard addition method. A quantitative spectrometry apparatus 100 includes a measurement unit 110 that spectroscopically analyzes an analysis-target sample 10 containing a component targeted for quantification in an unknown composition ratio and a reference sample containing the component targeted for quantification in a known composition ratio to obtain an original spectrum and a reference spectrum, a first generation unit 130 that generates, from these spectra, hypothetical addition spectra including a plurality of hypothetical addition rates as coefficients, a second generation unit that generates a plurality of analysis-target spectra from the respective hypothetical addition spectra, an extraction unit 170 that extracts a signal intensity profile of the component targeted for quantification corresponding to the hypothetical addition rates by performing a process including multivariate analysis, and a determination unit 190 that determines the unknown composition ratio of the component targeted for quantification contained in the analysis-target sample 10 from the dependence of the signal intensity profile on the hypothetical addition rates.

Description

TECHNICAL FIELD[0001]The present invention relates to a method for quantitative spectrometry, a quantitative spectrometry apparatus, and a program, and more specifically to a technique for determining an unknown composition ratio of a component targeted for quantification in a mixture by using spectroscopic analysis.BACKGROUND ART[0002]A standard addition method is known as a method for finding out the proportion (composition ratio) of a specific component contained in a mixture made by mixing diverse components. In the following, a description is given taking a solution as an example. In the standard addition method, in order to know an unknown composition ratio (concentration) of a specific component (hereinafter referred to as a component targeted for quantification) in a solution sample, a component identical to the component targeted for quantification is used as a solute and is added to the sample stepwise with the concentration of the component being changed.[0003]Signal inte...

Claims


Application Information

Patent Timeline
Patent Type & Authority Patents(United States)
IPC IPC(8): G01N21/65G01N33/49G01N21/31G01N21/27
CPCG01N21/65G01N33/49G01N2201/12G01N24/08G01N21/31G01N21/64G01N2201/1293
Inventor HAMAGUCHI, HIRO-OANDO, MASAHIRO
Owner SPECTROSCOPIC SCI LAB
Why Eureka
Try Eureka