Three dimension visual system based on geological body of geophysical field data
A technology of geophysics and geological bodies, applied in the field of 3D visualization of geological bodies, which can solve the problems of small amount of data, low practicability, waste of computing time and computer storage space, etc.
- Summary
- Abstract
- Description
- Claims
- Application Information
AI Technical Summary
Problems solved by technology
Method used
Image
Examples
Embodiment 1
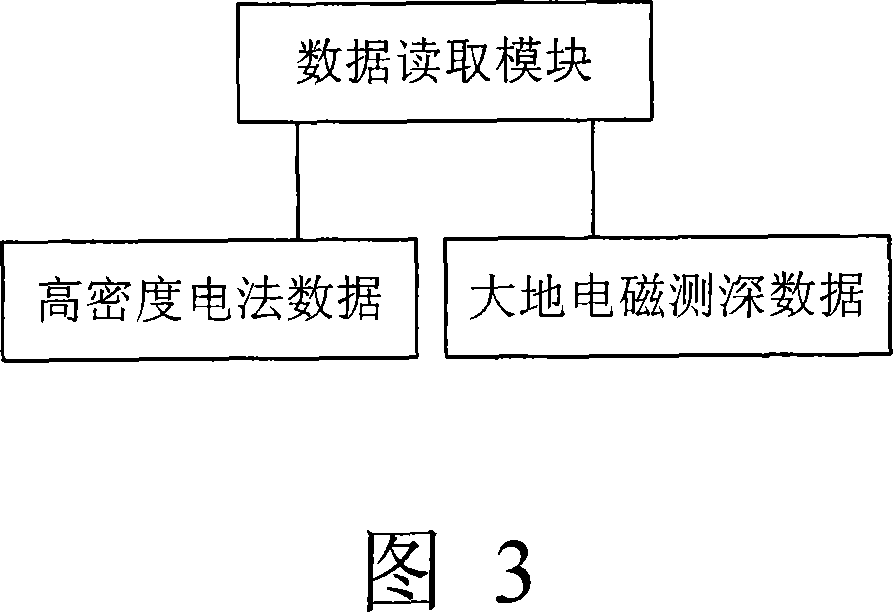
[0107] This embodiment is an example of high-density electrical method. In the field measurement of this embodiment, the DUK-2 high-density electrical instrument measuring system produced by Chongqing Geological Instrument Factory is used. The instrument is composed of a multi-channel electrode converter DUK-2 and a multifunctional direct current instrument DZD-6. , the observation parameter is the apparent resistivity ρs, and the cross-section electrodes are laid out at one time during the field measurement, and the acquisition parameters and device parameters of the instrument are set, then the measurement and storage of the apparent resistivity value of the cross-section can be performed automatically; data recovery to the laptop.
[0108] This field wiring method adopts the classic Wenner AMNB device (that is, the symmetrical quadrupole device method, WN). As shown in Figures 14 and 15, Figure 14 is an overall effect diagram of the sixth block of a certain working area ac...
Embodiment 2
[0112] This embodiment is an example of magnetotelluric sounding. In the field work of this embodiment, the most advanced magnetotelluric depth sounder GMS-06 produced by Metronix, Germany, which can not only process in real time, but also record and store the original time series, is used for data collection. There are six instruments in total, including two five-component systems and four two-component systems. During work, the six instruments are used at the same time, relying on the precise GPS system that comes with the instrument for synchronous recording.
[0113] As shown in Figures 17 and 18, Figure 17 is an overall effect diagram of the MT data measurement results of a certain work area according to the second embodiment of the present invention, and Figure 18 is a cutting effect of the MT data measurement results of a certain work area according to the second embodiment of the present invention picture.
[0114] As shown in Figures 19 and 20, Figure 19 is a statist...
PUM
 Abstract
Description
Claims
Application Information
 - R&D
- Intellectual Property
- Life Sciences
- Materials
- Tech Scout
- Unparalleled Data Quality
- Higher Quality Content
- 60% Fewer Hallucinations
Browse by: Latest US Patents, China's latest patents, Technical Efficacy Thesaurus, Application Domain, Technology Topic, Popular Technical Reports.
© 2025 PatSnap. All rights reserved.Legal|Privacy policy|Modern Slavery Act Transparency Statement|Sitemap|About US| Contact US: help@patsnap.com


