Digitized test method for CCD camera signal-to-noise ratio

A test method and camera technology, applied in image communication, TV, color TV components, etc., can solve the problems of relying on the operator's subjective judgment ability, high test cost, etc., and achieve the effect of low-cost and accurate measurement

Inactive Publication Date: 2008-01-23
BEIJING INSTITUTE OF TECHNOLOGYGY
0 Cites 9 Cited by

AI-Extracted Technical Summary

Problems solved by technology

But the required filters cost close to $10,000
Therefore, the above measurement methods have...

Abstract

The present invention provides a digitized testing method for the signal-to-noise ratio of a CCD video camera. The fundamental principle of the present invention is that the video camera images the high- uniform illuminating white and clean target, and the fluctuation of the imaging signal reflects the noise of the video camera. The video signal is quantified into a digital image through an image acquisition card, the noise signal is separated by a specially designed digital high-pass filter, and the root-mean-square value of the noise signal is calculated as the noise intensity. The image acquisition card brings a quantizing noise into the original video signal, the quantizing noise is modified to estimate the value of the noise in the original video signal, and thereby the signal-to-noise ratio can be worked out. The present invention achieves the fast speed and objective testing method of the television camera signal-to-noise ratio based on digital image acquisition, the testing result is as good as the result of the video analyzer, thus the method can be used as a replacement method for video camera signal-to-noise testing.

Application Domain

Technology Topic

Image

  • Digitized test method for CCD camera signal-to-noise ratio
  • Digitized test method for CCD camera signal-to-noise ratio
  • Digitized test method for CCD camera signal-to-noise ratio

Examples

  • Experimental program(1)

Example Embodiment

[0036] The present invention will be further described below in conjunction with the drawings and embodiments. For the convenience of explanation, an 8-bit frame grabber is used as an example to introduce:
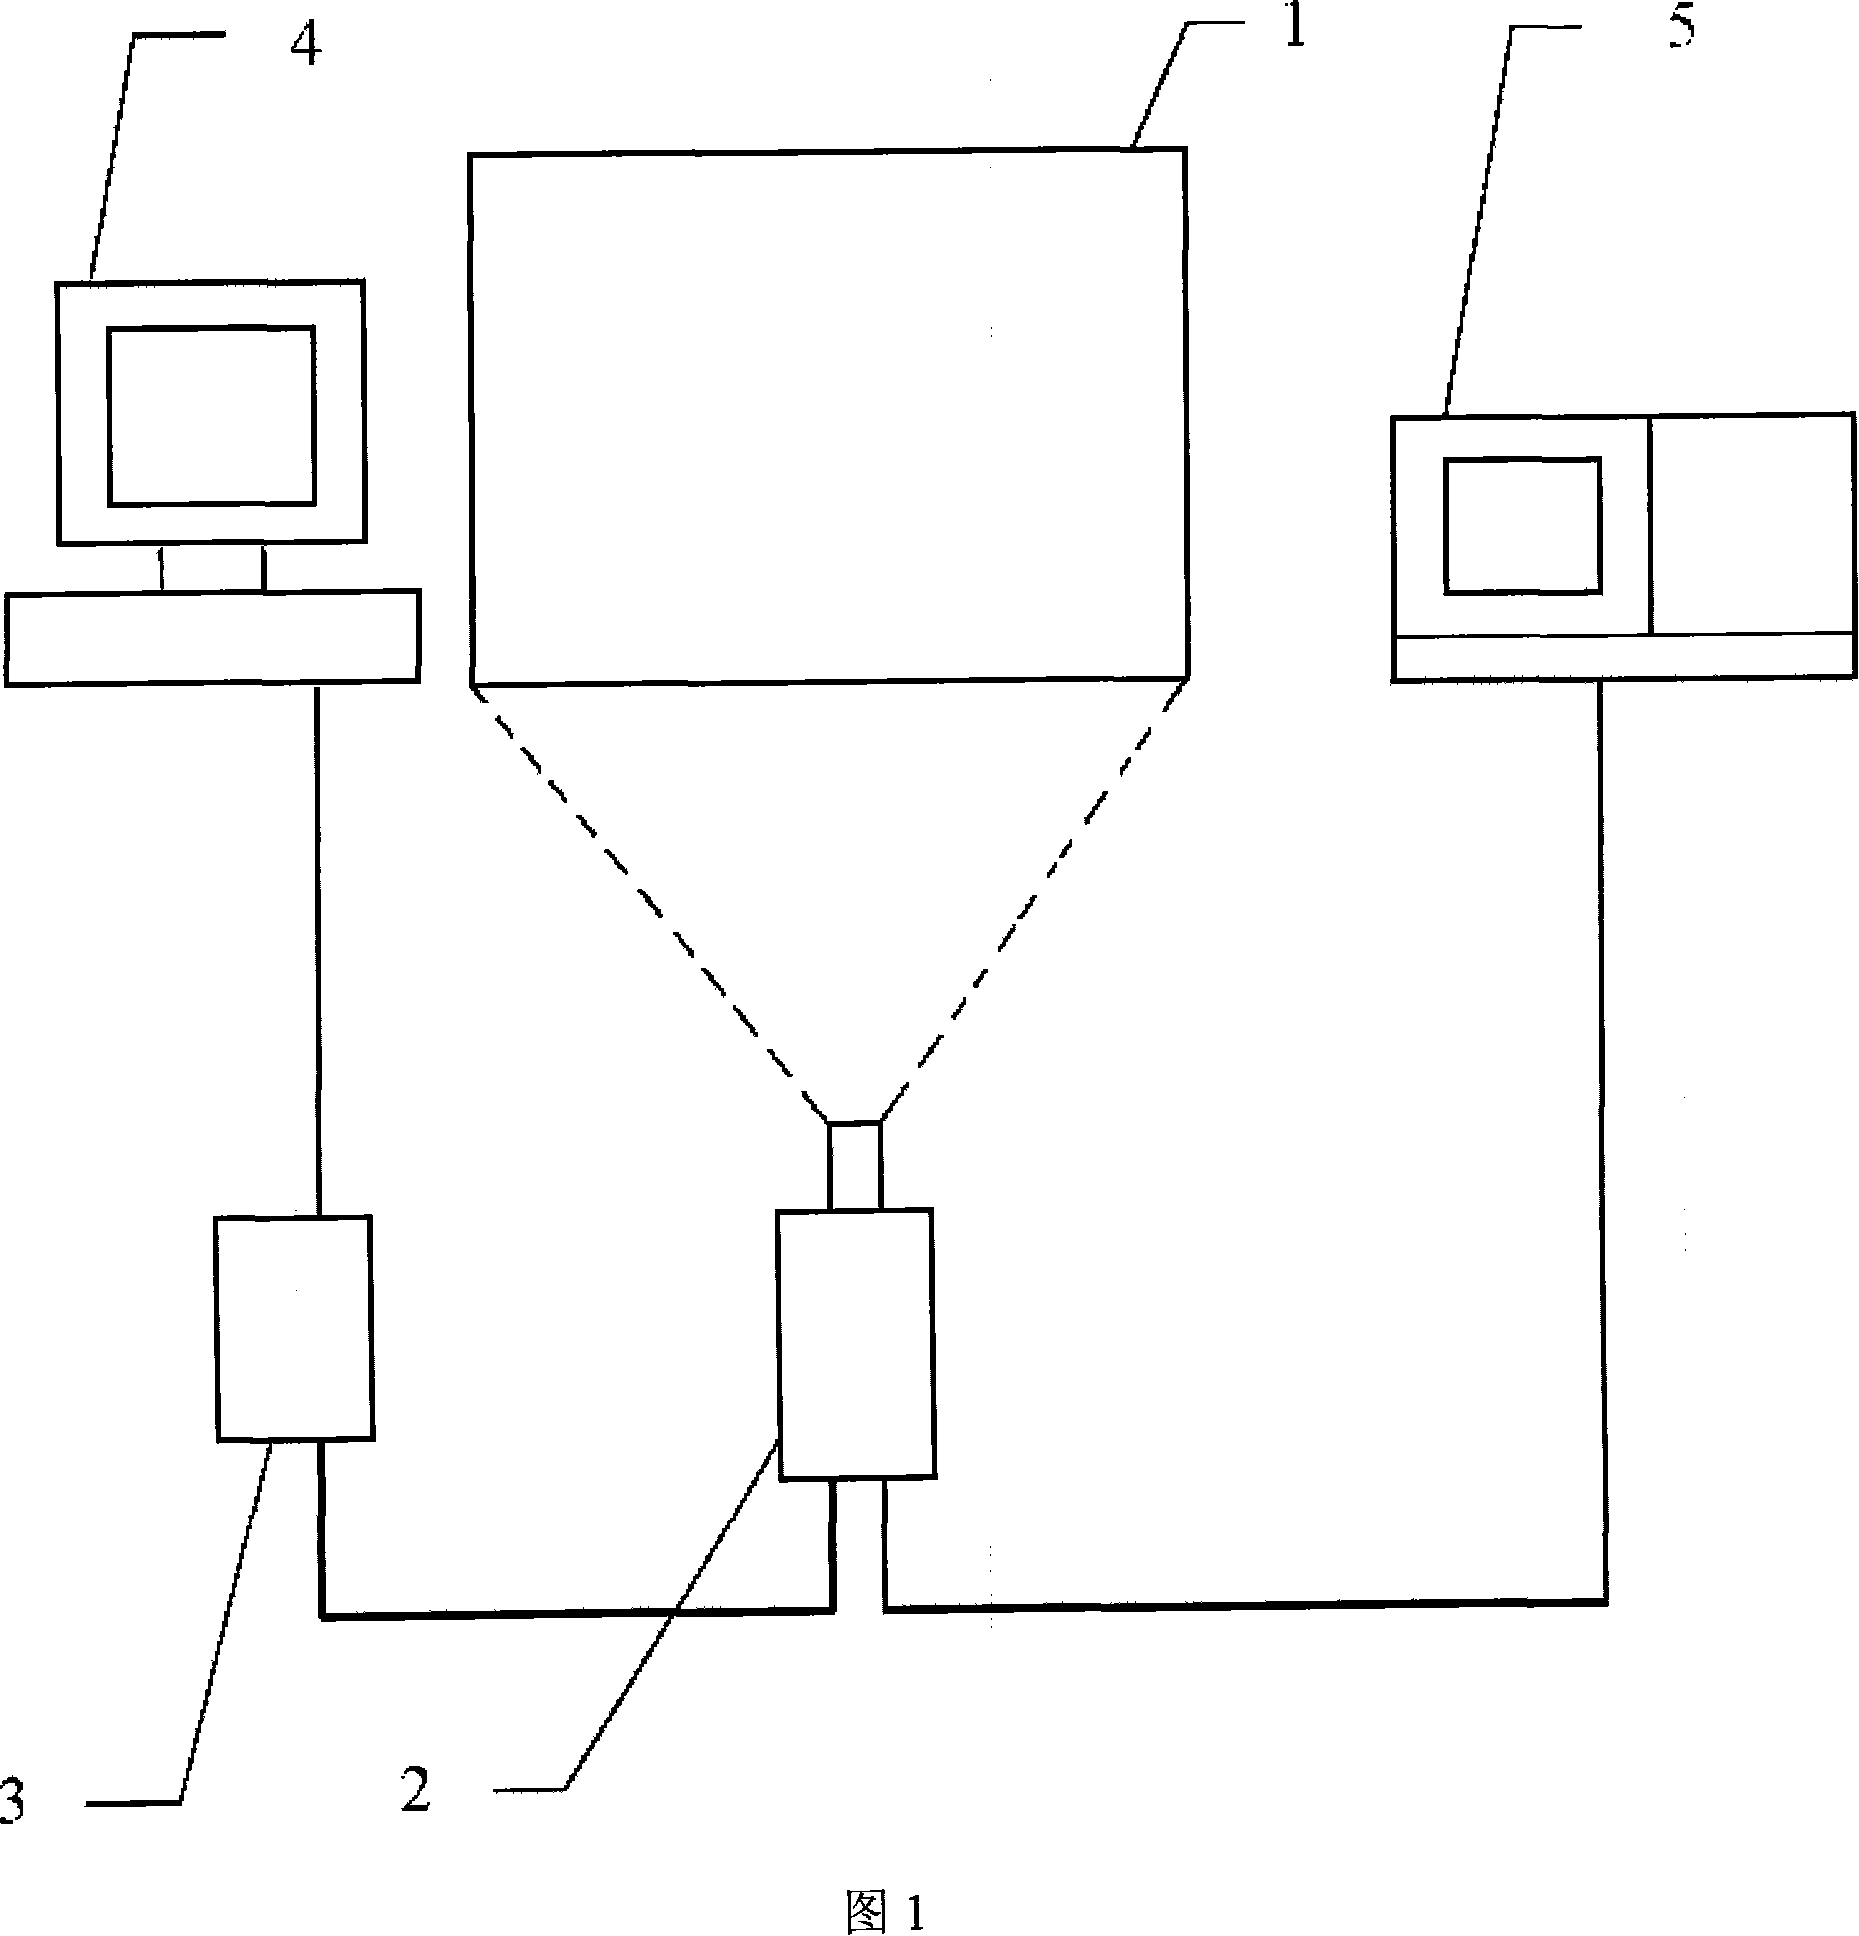
[0037] As shown in Figure 1, the CCD camera signal-to-noise ratio digital test system designed according to the present invention is mainly composed of uniform lighting light box 1, to-be-tested CCD camera 2, image acquisition card 3, computer 4 and oscilloscope 5 for auxiliary reading. .
[0038] The basic implementation process is: the camera 2 shoots the transmissive target at the exit of the uniformly illuminated light box 1, and the fluctuation in the imaging signal reflects the noise of the camera 2. The video signal of the camera 2 is quantized into a digital image by the image capture card 3 and sent to the computer 4 for processing. A specially designed digital high-pass filter is used to separate the noise signal, and the root mean square value of the noise is calculated as the noise intensity. Since the image acquisition card 3 brings quantization noise to the original video signal of the camera 2, the magnitude of the noise in the original video signal of the camera 2 can be estimated by correcting the quantization noise. The oscilloscope 5 uses conventional means to measure the noise of the camera 2 to provide comparison and reference for the digital signal-to-noise ratio measurement.
[0039] 1) Uniform illumination light box
[0040] The lighting box can provide standard illuminance conditions with an illuminance of 2000Lx and a color temperature of 3100K. In order to highlight the noise signal in the video, the lighting box needs to provide a highly uniform surface light source with brightness unevenness ≤5%. This can be achieved by evenly placing multiple sets of fluorescent tubes behind the multi-layer opal glass plate, or directly choose a large-caliber integrating sphere for illumination. In order to test the signal-to-noise ratio of the camera under different illuminance conditions, the exit illuminance of the light box can be adjusted.
[0041] 2) Selection of the quantization depth of the frame grabber
[0042] The frame grabber is actually an A/D converter, and its quantization bit determines the size of the quantization noise. Suppose the quantization interval is Δ, and the quantization error is uniformly distributed in the interval [-Δ/2, Δ/2], then the noise variance (D(N q )) can be calculated as follows:
[0043] D ( N q ) = ∫ - Δ / 2 Δ / 2 1 Δ x 2 dx = Δ 2 12 - - - ( 1 )
[0044] If the quantization level is N bits, the maximum quantized signal amplitude is 2 N Δ, so the quantized signal-to-noise ratio brought in by the quantization process is calculated as follows:
[0045] S / N = 201 g V ref N q = 201 g 2 N Δ Δ 2 / 12 ( 6.02 N + 10.8 ) dB - - - ( 2 )
[0046] It can be seen that increasing the number of quantization bits can reduce the quantization noise. Each additional quantization bit can increase the signal-to-noise ratio by approximately 6dB. When 8-bit quantization (corresponding to 256 gray levels), the quantization signal-to-noise ratio is about 59dB, which can meet the signal-to-noise ratio test requirements of most TV cameras (the signal-to-noise ratio is about 45-55dB). If the camera's own signal-to-noise ratio is very high (≥59dB), a higher quantization-level image acquisition card must be used to quantify the noise signal.
[0047] 3) The basic implementation process of the digital test of TV camera signal-to-noise ratio is as follows:
[0048] a) Under standard illuminance conditions of 2000Lx and 3100K color temperature, adjust the aperture of the camera lens and shoot the exit whiteboard of the uniformly illuminated light box, and ensure that the output image is not saturated (in the case of 8-bit quantization, that is, to ensure the average after quantization The grayscale is less than 255, and the maximum grayscale value of the pixel is also less than or equal to 255. Two frames of digital images P1 and P2 are captured respectively, as shown in Figure 2 and Figure 3.
[0049] b) Subtract the digital images P1 and P2 pixel by pixel to obtain a new image P3, as shown in Figure 4. The new picture no longer contains the influence of the uneven illumination of the light box on the noise test.
[0050]c) Use the high-pass filter H to digitally filter the image P3 to obtain a noise image P4, as shown in FIG. The selected high-pass filter template is:
[0051] H = 1 / 6 - 1 / 3 1 / 6 - 1 / 3 2 / 3 - 1 / 3 1 / 6 - 1 / 3 1 / 6
[0052] The frequency domain filter corresponding to filter H is shown in Figure 6, which shows that this filter is a typical high-pass filter. Using this template to perform convolution operation on the image is equivalent to performing spatial filtering on the image. The operation process of spatial filtering is:
[0053] f ′ ( x , y ) = 1 6 f ( x - 1 , y - 1 ) - 1 3 f ( x - 1 , y ) + 1 6 f ( x - 1 , y + 1 )
[0054] - 1 3 f ( x , y - 1 ) + 2 3 f ( x , y ) - 1 3 f ( x , y + 1 )
[0055] + 1 6 f ( x + 1 , y - 1 ) - 1 3 f ( x + 1 , y ) + 1 6 f ( x + 1 , y + 1 )
[0056] Where f(x, y) is the gray value of the pixel at the coordinate (x, y) in the original image, and f'(x, y) is the gray value of the corresponding point after filtering.
[0057] Assuming that the noise of each pixel in the image obeys the same distribution, the noise variance of the filtered pixel is:
[0058] D ( f ′ ( x , y ) ) = ( ( 1 6 ) 2 × 4 + ( - 1 3 ) 2 × 4 + ( 2 3 ) 2 ) D ( f ( x , y ) ) = D ( f ( x , y ) )
[0059] Among them, D(f'(x,y)) is the variance of the noise point after filtering, and D(f(x,y) is the variance of the noise point before filtering.
[0060] It can be seen that selecting this filter can not only effectively filter out the noise, but also has no amplification effect on the noise of the original image.
[0061] d) Calculate the variance σ of P4 2 , Which contains the inherent camera noise (N rms ) And frame grabber quantization noise (N q ), and D(N rms +N q )=σ 2 /2. Because the inherent noise of the camera and the quantization noise of the image capture card are independent of each other, and from the formula (1), the quantization noise is about 1/12 of a quantization interval (in terms of variance). So the inherent noise of the camera can be calculated as follows:
[0062] D(N rms )=σ 2 /2-1/12
[0063] Therefore, when 8-bit quantization is used, the calculation formula of the camera SNR is:
[0064] S / N = 201 g 255 N rms = 201 g 255 σ 2 / 2 - 1 / 12 - - - ( 3 )
[0065] 4) Test results:
[0066] According to the CCD camera signal-to-noise ratio test system built according to the above test method, the outlet size of the uniform illumination light box is 250×190mm, and the brightness unevenness is less than 3% after testing.
[0067] The signal-to-noise ratio test was carried out under 2000Lx illumination, using an 8-bit frame grabber, and the test object was a Mintong MTV-2821 monochrome camera with a nominal signal-to-noise ratio of 50dB. The four images continuously collected in the experiment are shown in Table 1:
[0068] Table 1. Four consecutive images of uniformly illuminated targets in the experiment
[0069] Image number
[0070] The processing results of the signal-to-noise ratio obtained by formula (3) are shown in Table 2:
[0071] Table 2. The signal-to-noise ratio obtained using the digital signal-to-noise ratio measurement method
[0072]
[0073] It can be seen from the test data that the present invention realizes a fast and objective test method for the signal-to-noise ratio of a TV camera based on digital image acquisition. The measurement repeatability is good, and the test result is consistent with the measurement result of the video analyzer, so it can be used as a CCD camera signal. An alternative method of noise ratio testing.

PUM

no PUM

Description & Claims & Application Information

We can also present the details of the Description, Claims and Application information to help users get a comprehensive understanding of the technical details of the patent, such as background art, summary of invention, brief description of drawings, description of embodiments, and other original content. On the other hand, users can also determine the specific scope of protection of the technology through the list of claims; as well as understand the changes in the life cycle of the technology with the presentation of the patent timeline. Login to view more.

Similar technology patents

Single deck dual tape path VCR system

InactiveUSRE37881E1Minimize time delayLow costTelevision system detailsHelical scan formatVideocassette recorderStandard element
Owner:DIGITAL NETWORKS NORTH AMERICA

Energy management of household appliances

ActiveUS20100070091A1Significant savingLow costTemperatue controlStatic/dynamic balance measurementEnergy managementEngineering
Owner:HAIER US APPLIANCE SOLUTIONS INC

Classification and recommendation of technical efficacy words

  • Low cost
  • Accurate measurement

System and method for transmitting wireless digital service signals via power transmission lines

ActiveUS7929940B1Reduce bandwidth requirementLow costInterconnection arrangementsWireless systems/telephoneElectric power transmissionBase transceiver station
Owner:NEXTEL COMMUNICATIONS

Nanowire structures comprising carbon

ActiveUS20070212538A1Low costImproved electrical connectivity and stabilityElectric discharge heatingFuel cells groupingNanometreMembrane configuration
Owner:ONED MATERIAL INC

Surgical suturing apparatus with measurement structure

InactiveUS20060036232A1Accurate measurementSuture equipmentsDiagnosticsSurgical sutureSurgical stapling
Owner:TYCO HEALTHCARE GRP LP
Why Eureka
Try Eureka