

Data group graph notation and apparatus thereof
A graphic representation and data group technology, applied to financial statement data, can solve problems such as difficult for readers to detect performance decline and fooling readers
- Summary
- Abstract
- Description
- Claims
- Application Information
AI Technical Summary
Problems solved by technology
Method used
Image

Examples
no. 1 example
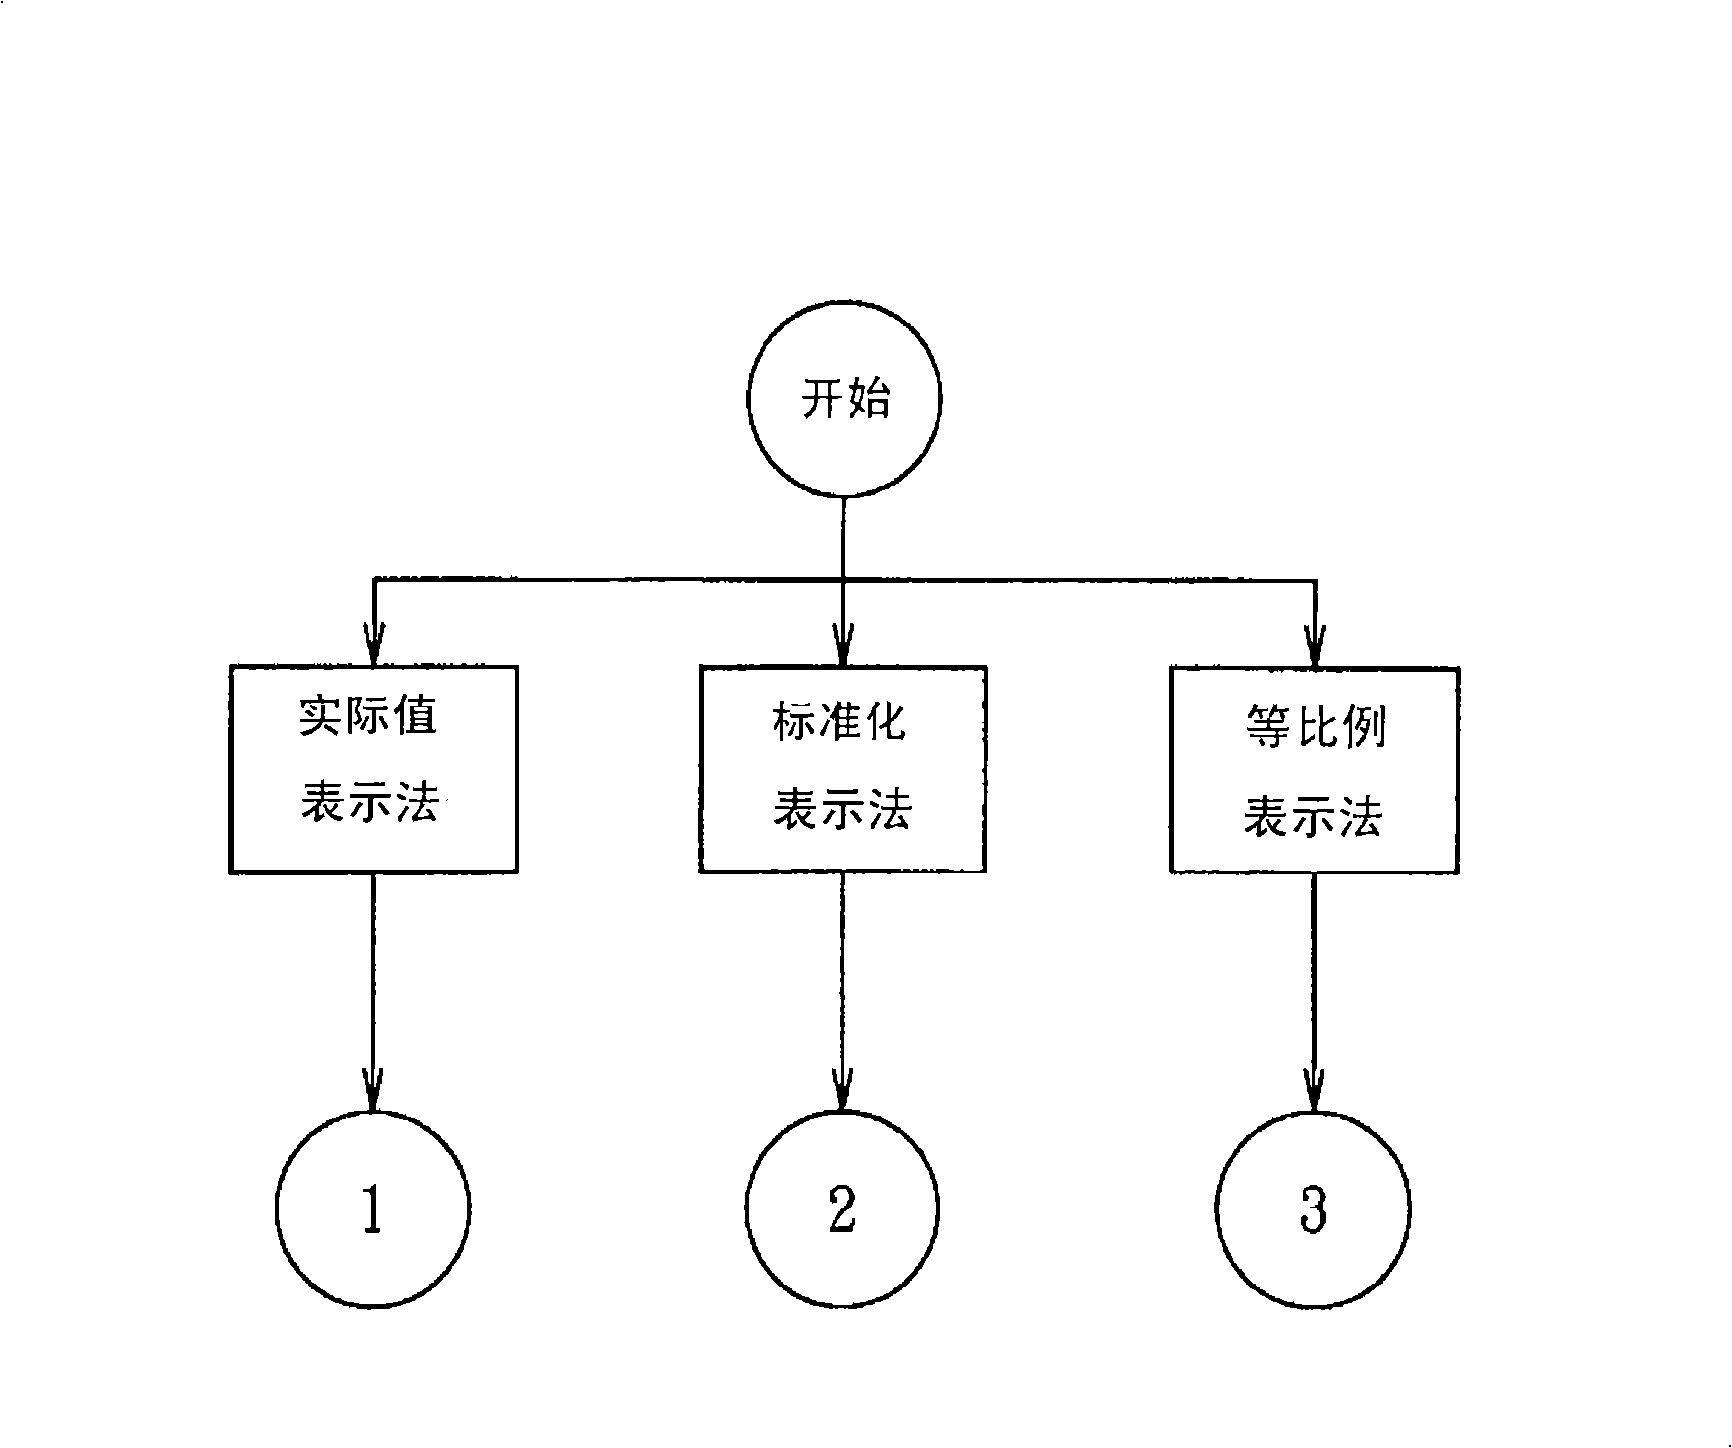
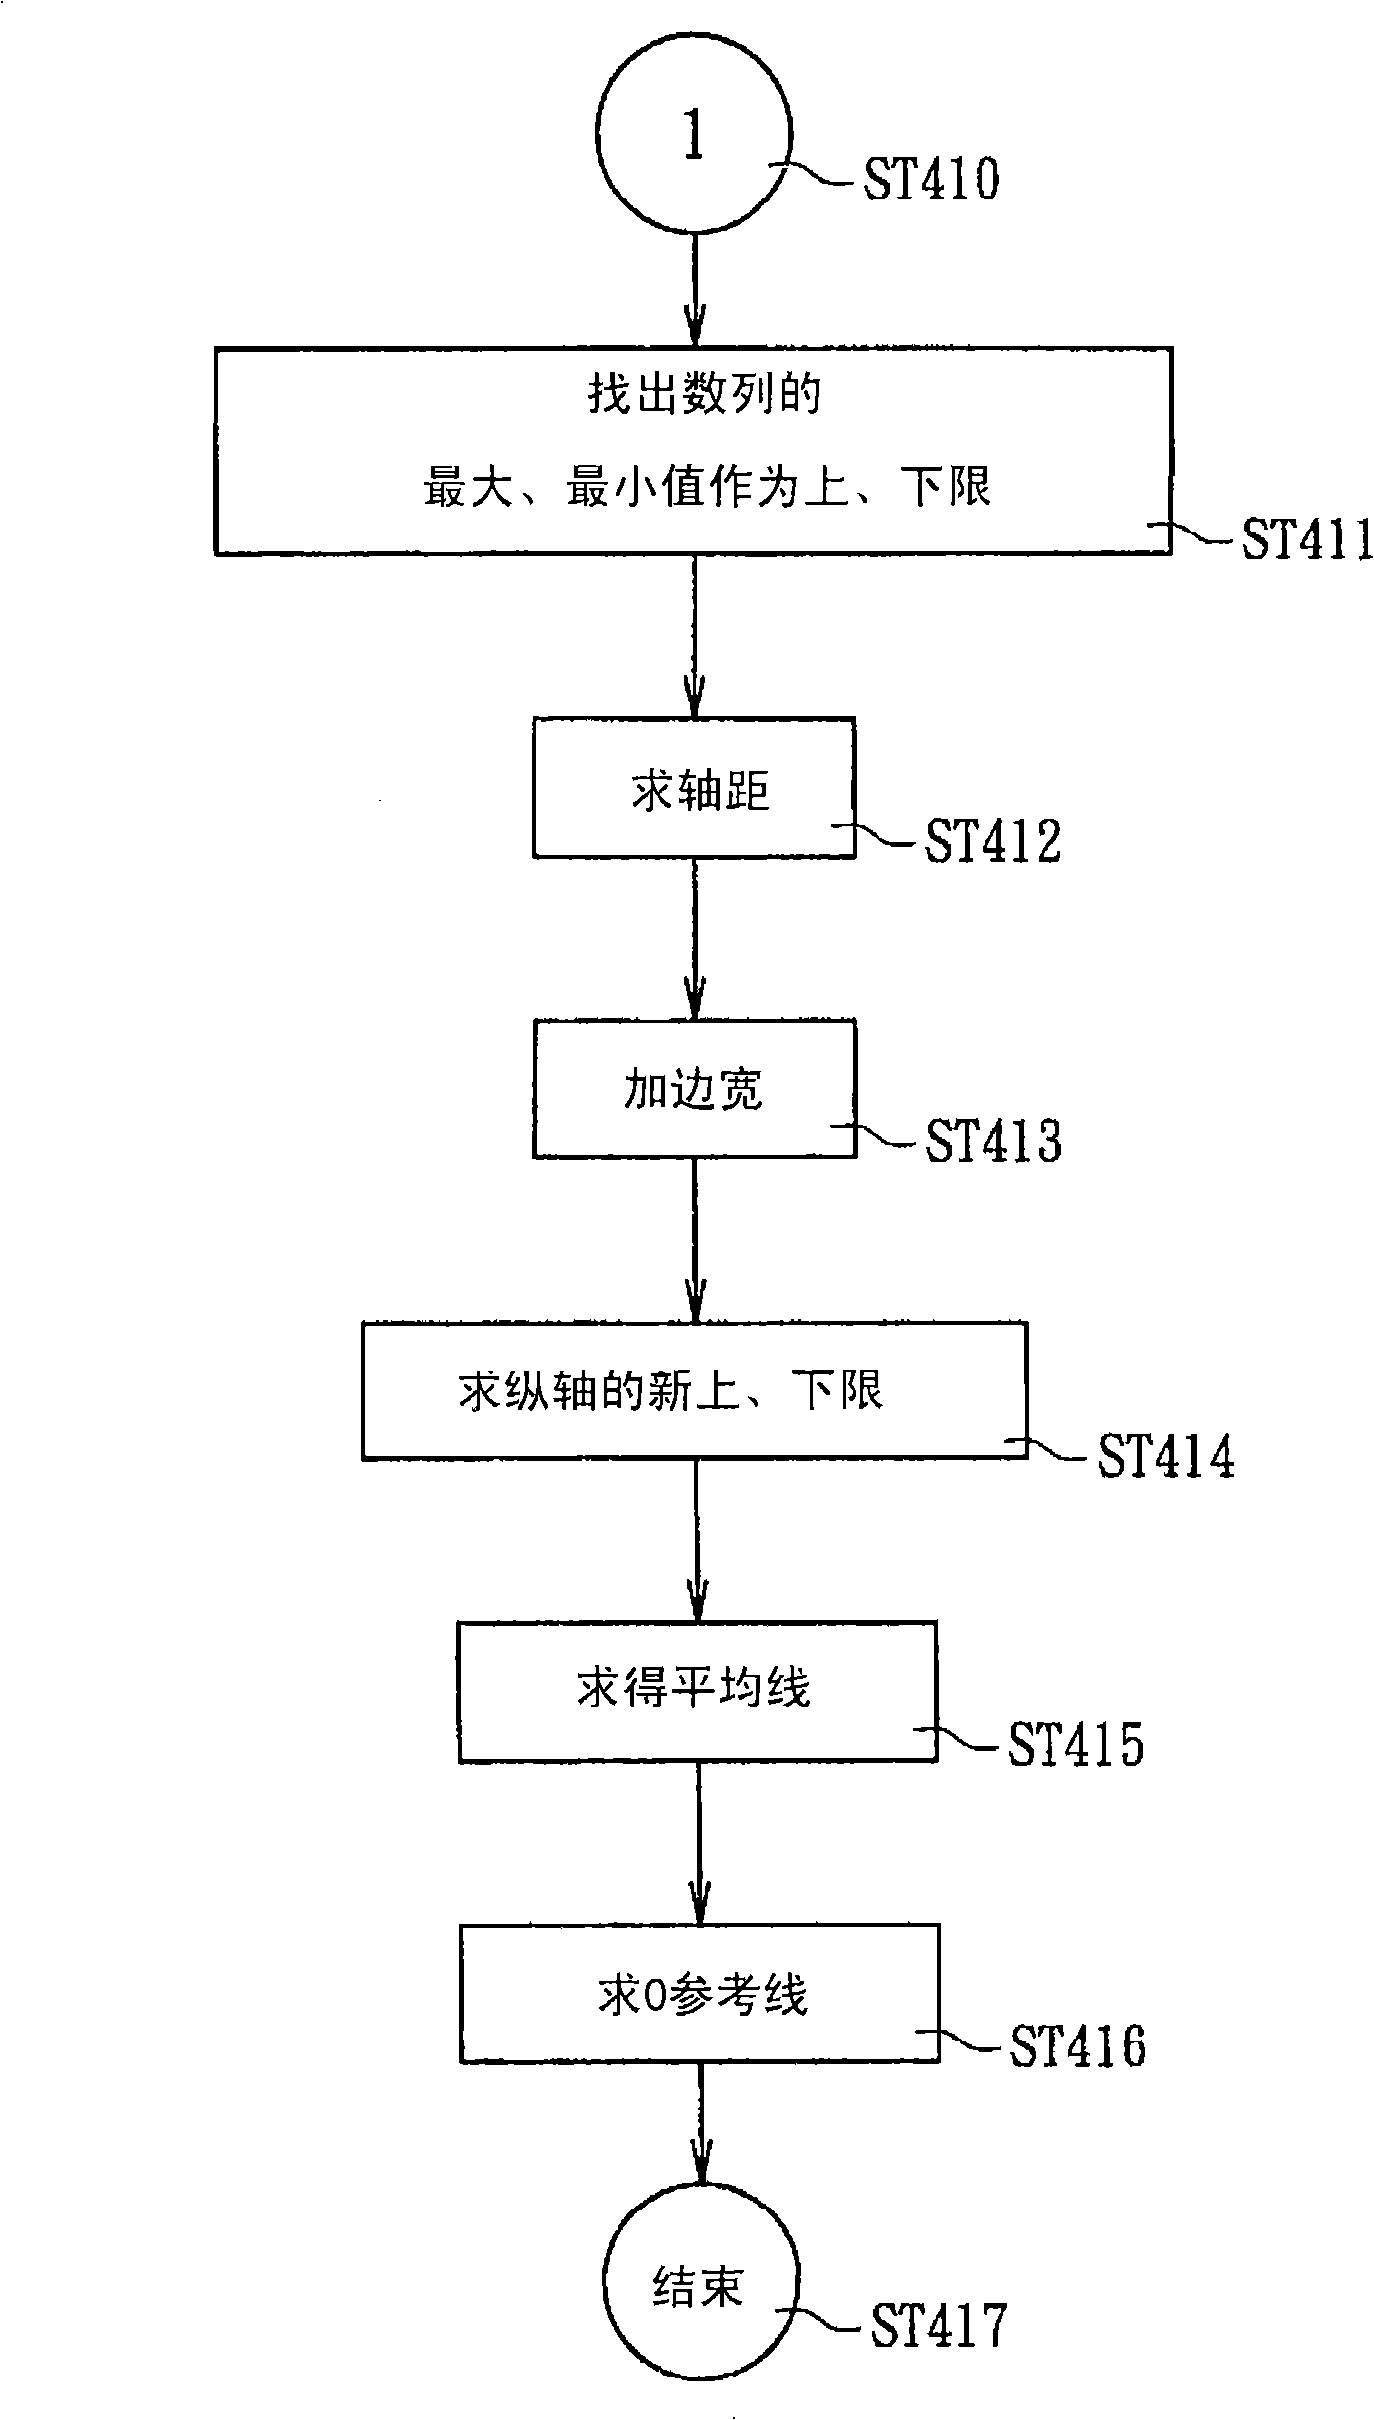
[0038] actual value notation
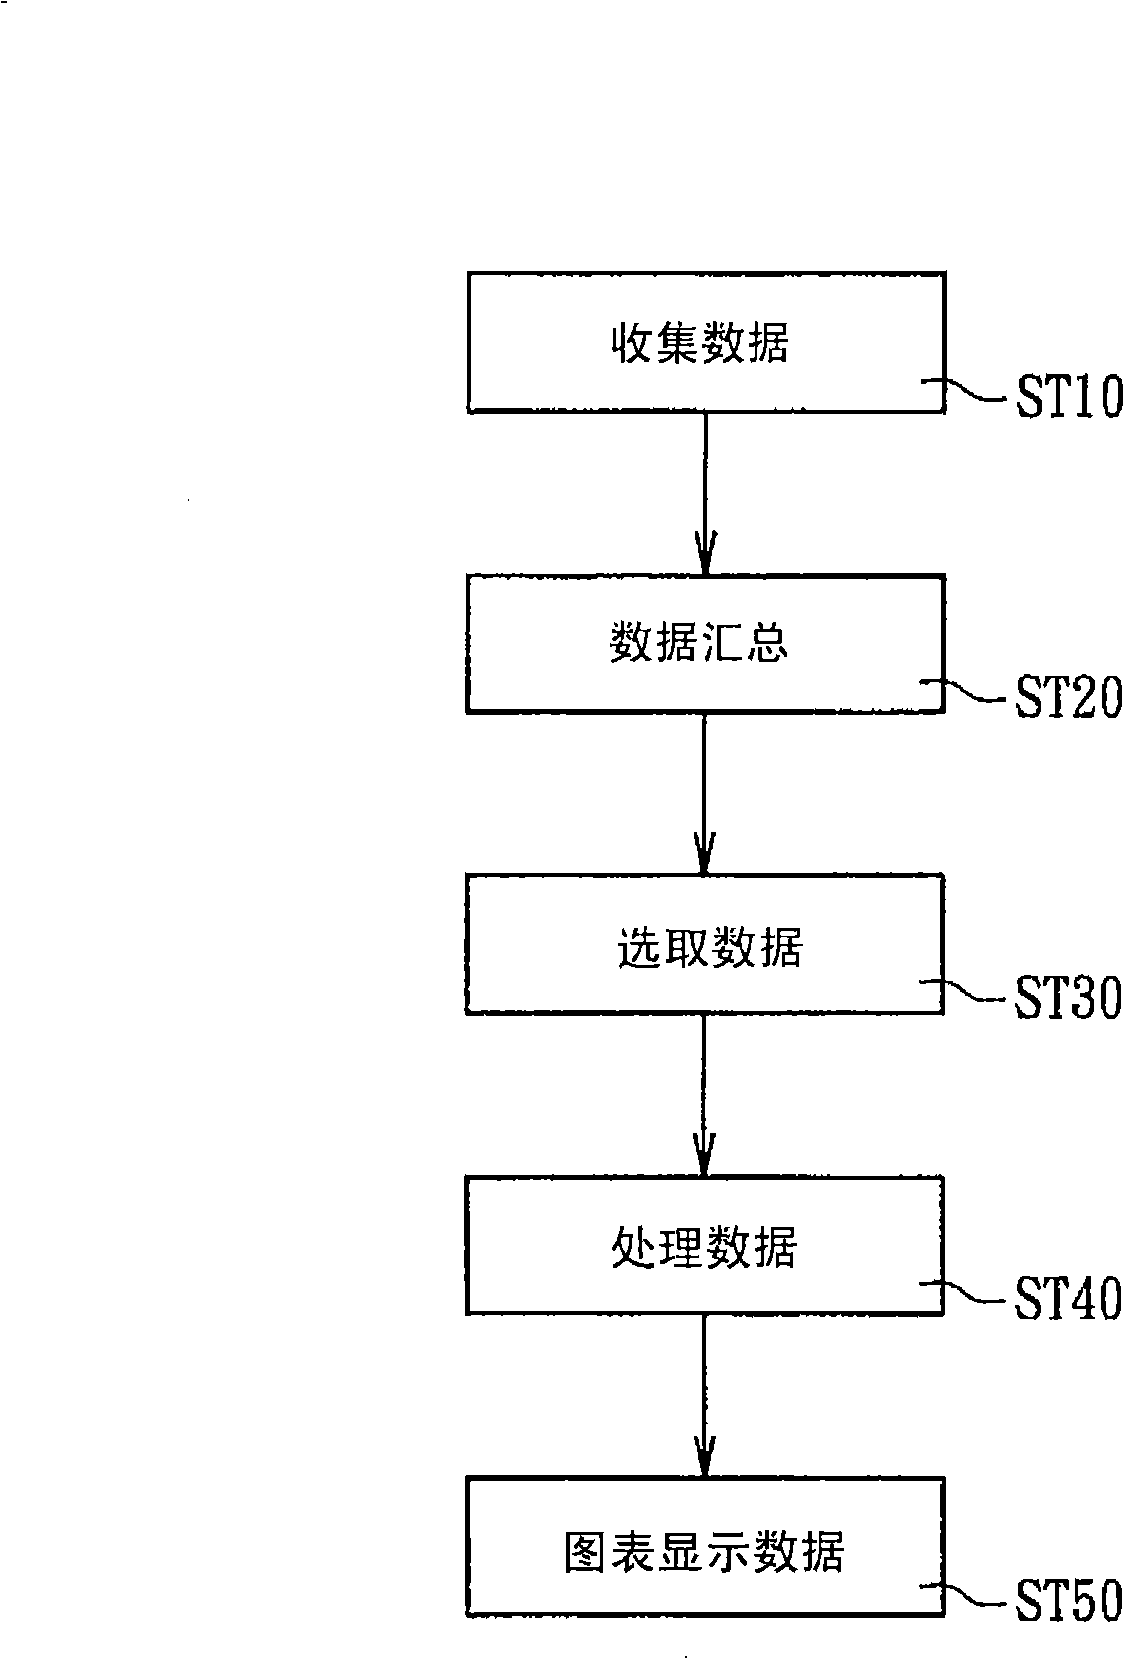
[0039] The first embodiment of the present invention is to take the actual value as the ordinate scale of the graph, and its data processing method please refer to image 3 illustrate. The process starts at ST410, and then, in step ST411, the maximum value and the minimum value are found in the input data items as the upper and lower limits. Then, in step ST412, subtract the maximum value from the minimum value, and then divide the result by the number of data you want to mark to obtain the wheelbase. For example, when the data is displayed on paper or a computer monitor, you can divide Take 10, on the contrary, if it is a display device such as a PDA and a mobile phone, it can be divided by 5 to obtain the appropriate wheelbase. In addition, in step ST413, if the user wants to keep the side width of the graph, the maximum value and the minimum value plus 0 to 1 times the wheelbase can be displayed or printed as data according to the desired si...
no. 2 example
[0052] standardized notation
[0053] For the data processing method of the standardized representation in this embodiment, please refer to Figure 4 illustrate. The flow starts at ST420, and then at step ST421, all the data in the data is read in, and then, at step ST422, the absolute value of each data is taken. Next, in step ST423 , the largest of the absolute values is used as a normalization factor, and each data is divided by the normalization factor one by one, so that normalization is obtained, so all the data will be normalized. Next, in step ST424, a step of obtaining upper and lower limits is performed. Since there must be a +1 or -1 after standardization, if the reader wants to clearly see the trend and change of the data, he can specify +1 as the maximum value (upper limit) and the minimum value as the lower limit, or, Specify -1 as the minimum value (lower limit) and the maximum value as the upper limit. Of course, if the reader wants to see the distribution...
no. 3 example
[0064] Isometric representation
[0065] When two data groups are to be compared on the double vertical axis, because the traditional drawing method does not have a standard, the display scales of the two vertical axes for comparison are often inconsistent and mislead the reader's feelings. In this case , the data processing flow of the proportional representation method of the present invention can show its effect more. For the processing data flow of the proportional representation in this embodiment, please refer to Figure 5 illustrate. The process begins at ST430, and then finds out the maximum and minimum values that do not need to be corrected in the two data groups as the upper and lower limits in ST431, and then performs calculations in ST432 to obtain the upper limit or lower limit of the vertical axis that needs to be corrected, and find the vertical axis on both sides. The wheelbase of the axle (ST433), the extra edge width (ST434), obtain the new upper and low...
PUM
 Abstract
Description
Claims
Application Information