Udder health characteristics
A breast, health technology, applied in the field of genetically marked diagnostic kits, which can solve problems such as limited positioning resolution
- Summary
- Abstract
- Description
- Claims
- Application Information
AI Technical Summary
Problems solved by technology
Method used
Image
Examples
Embodiment 1
[0622] BTA1
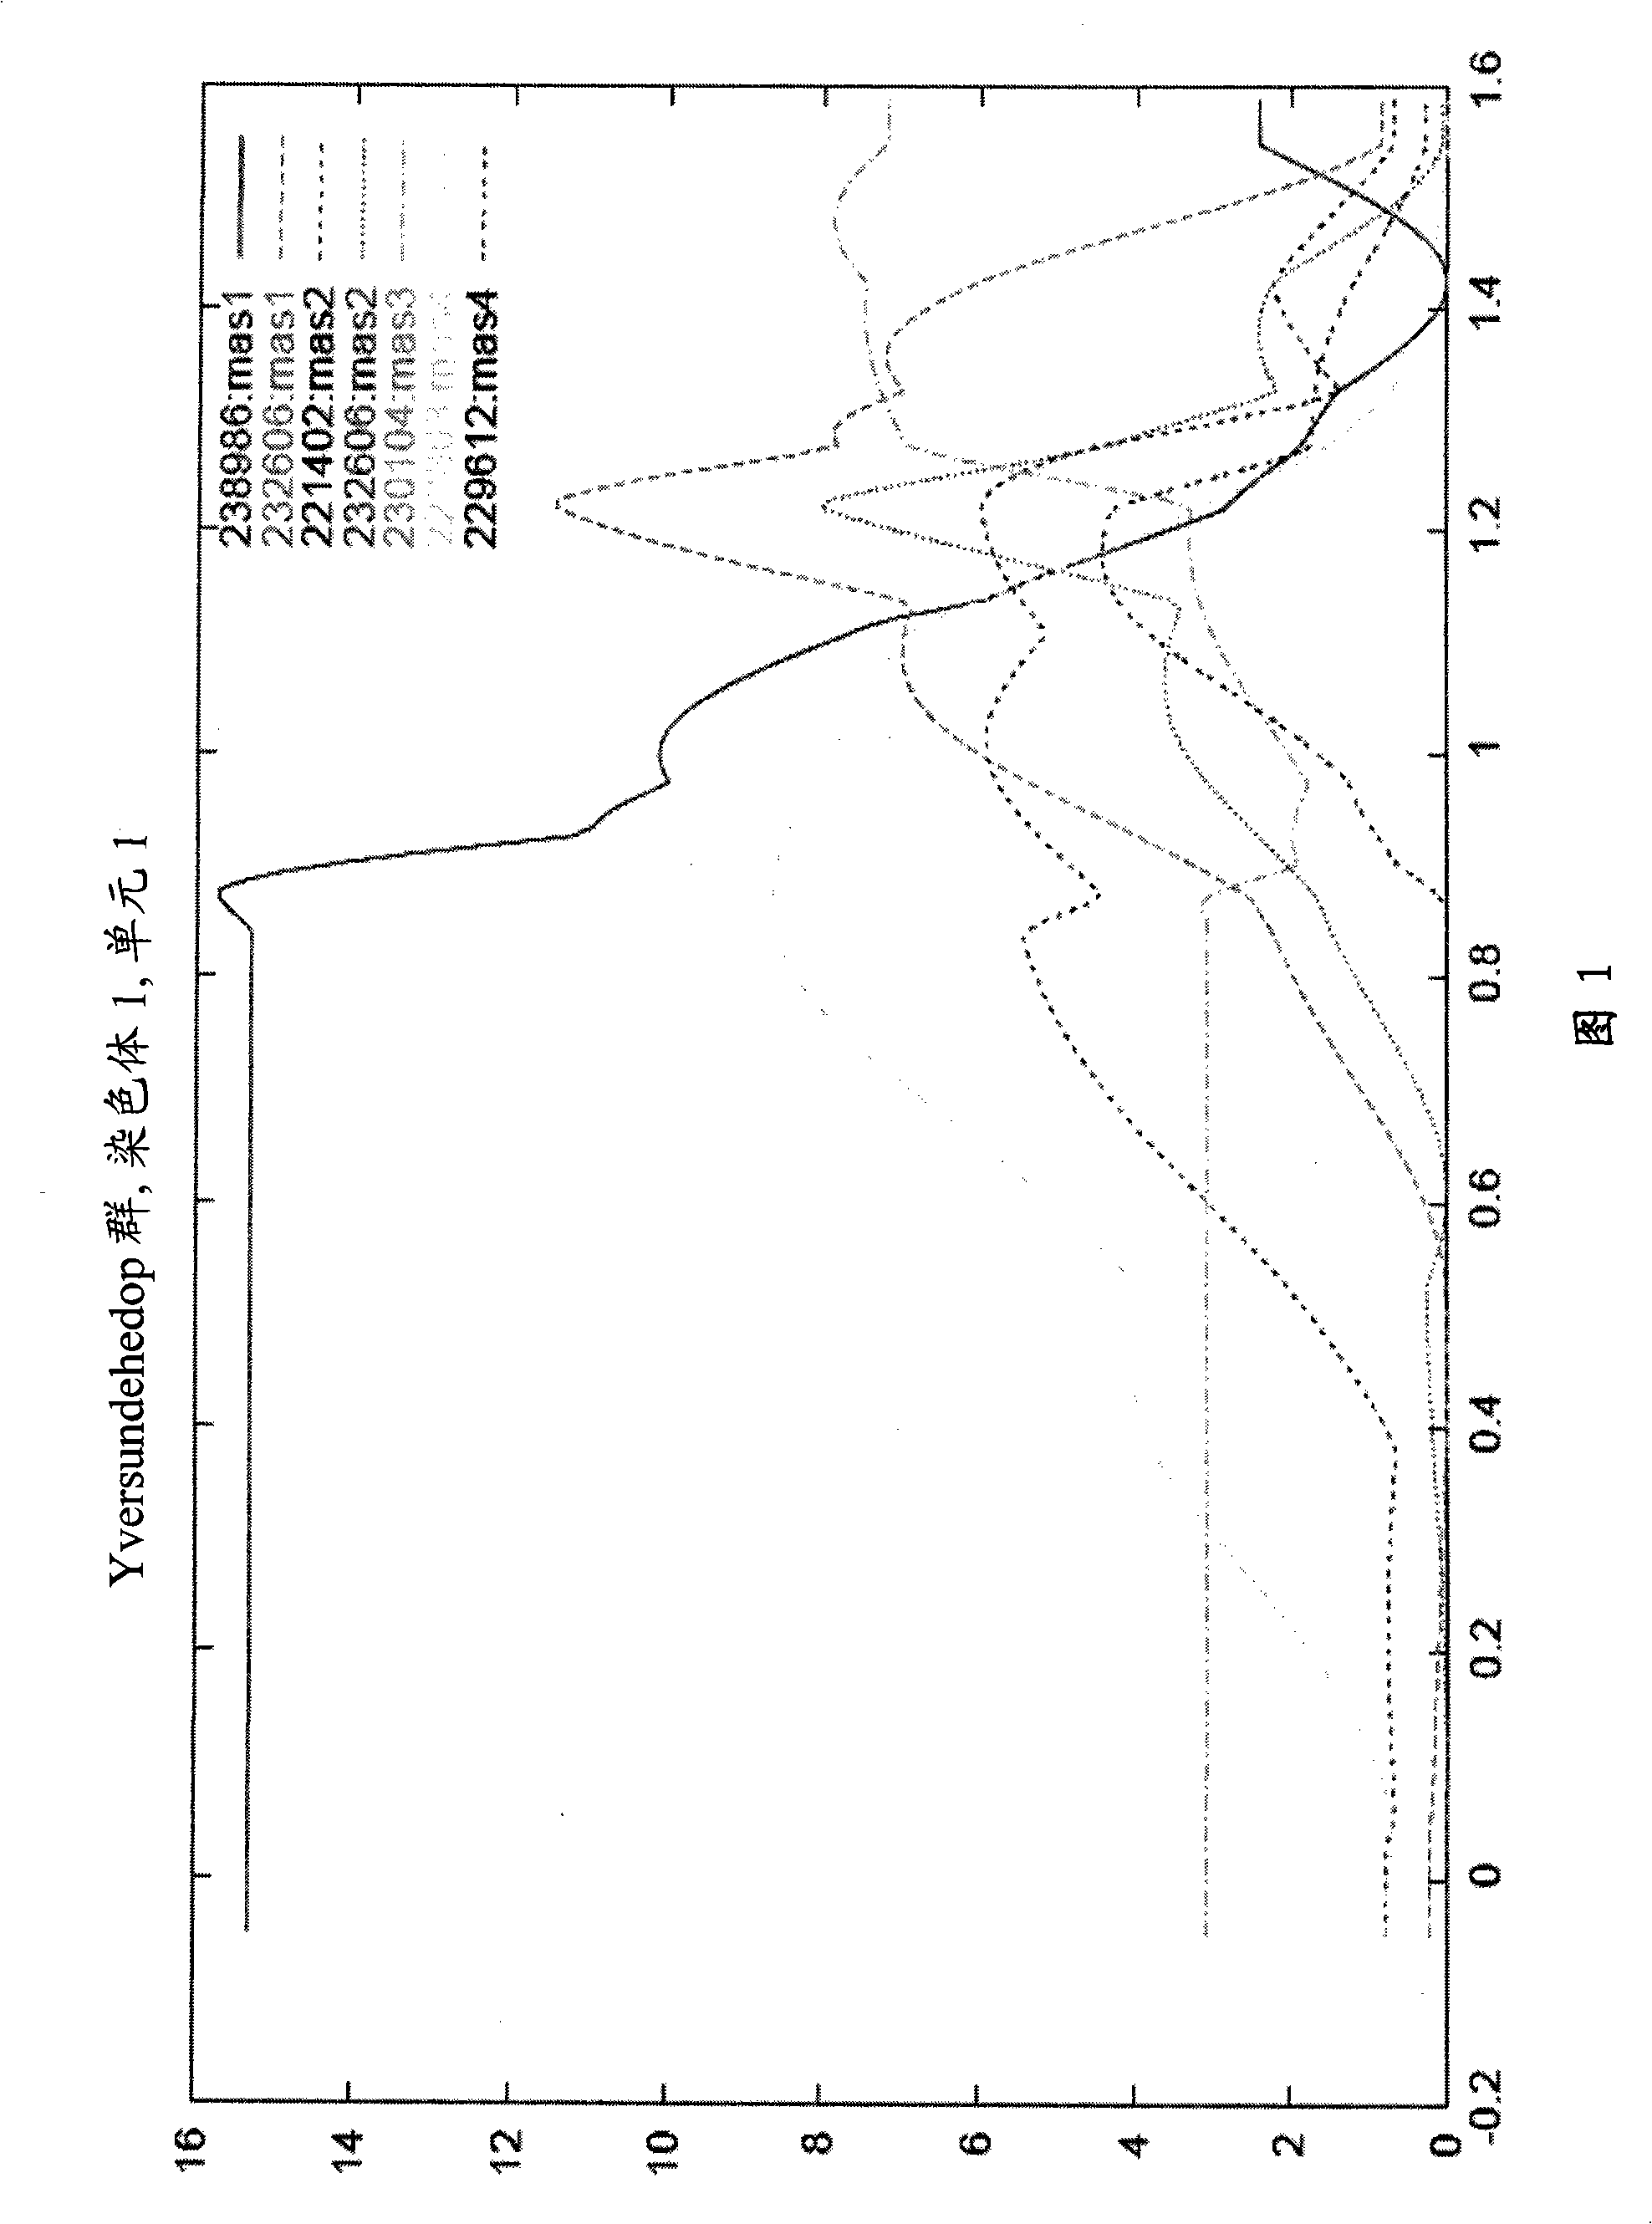
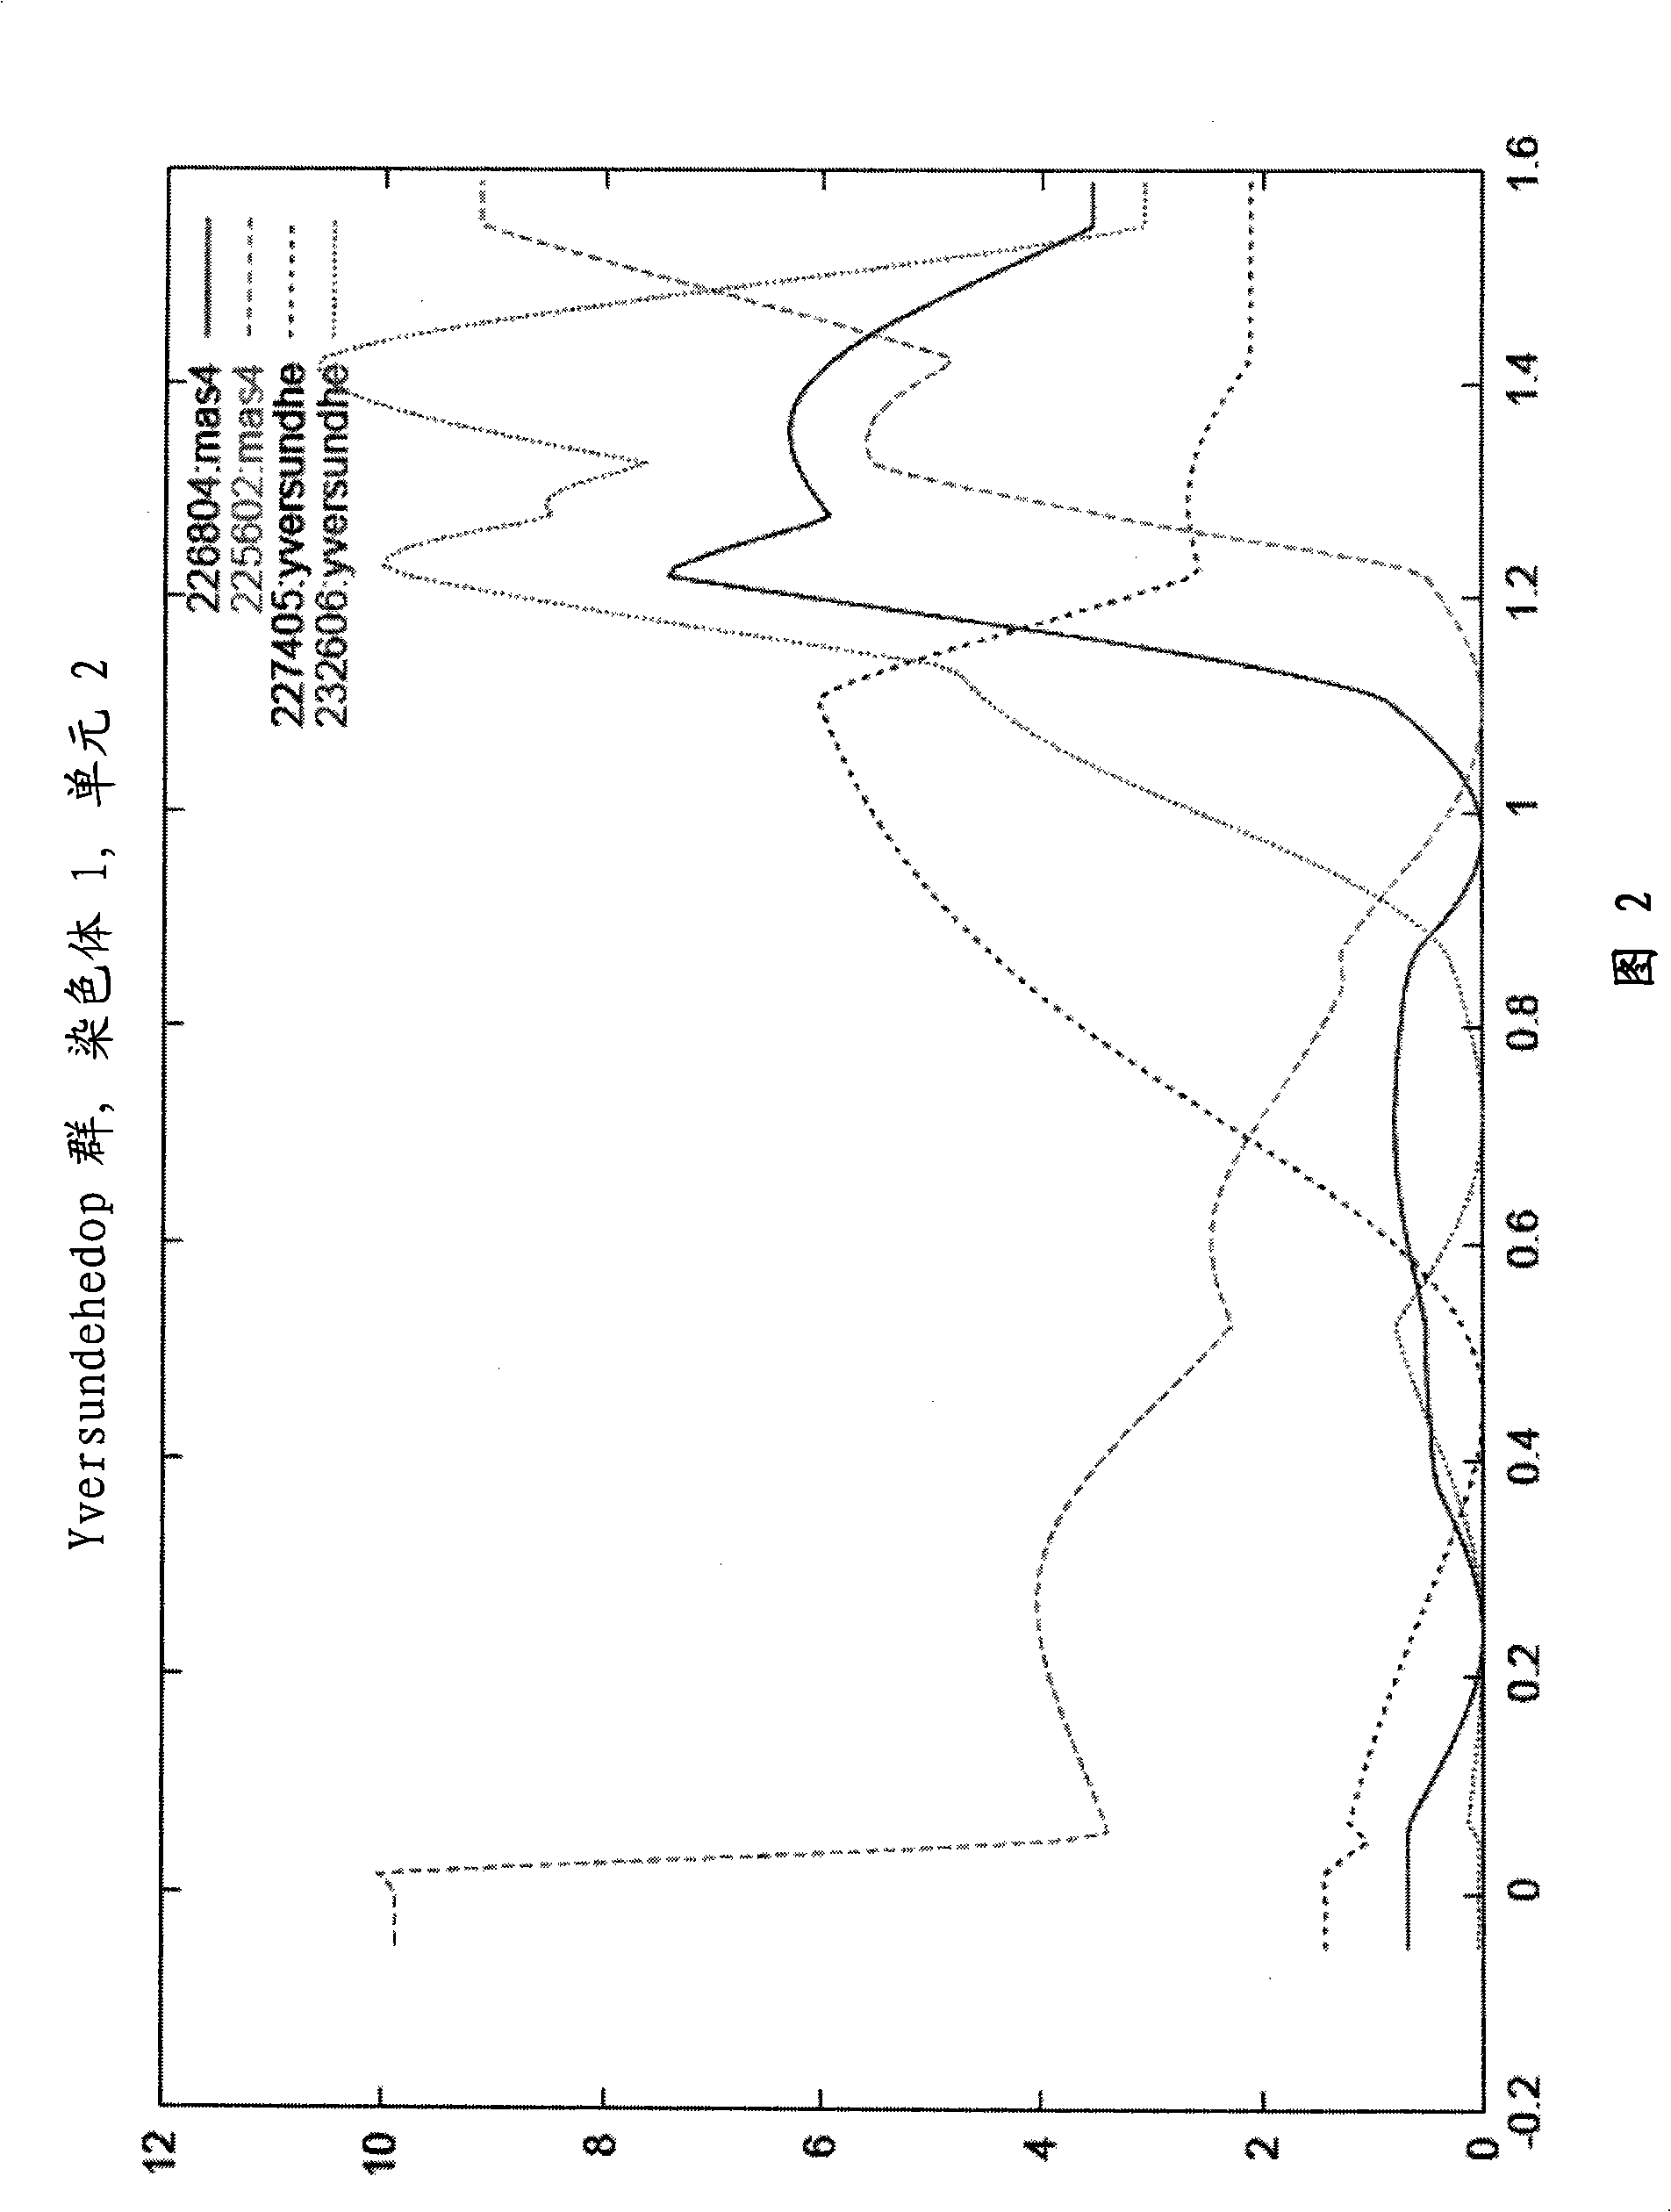
[0623] Table 17 lists the regression analysis structure for BTA1. Figures 1 and 2 show the QTL plots used in the regression analysis. The variance components method was used to detect cross-family QTLs for CELL, MAS1, MAS2, MAS3, MAS4, and breast health index in single-trait analysis (including all paternal families in one analysis). No significant QTLs were detected for CELL, MAS1, MAS2, MAS3, MAS4 and breast health index in the cross-family analysis. No signal was given for pleiotropic QTLs affecting the traits CELL, MAS1, MAS2, MAS3, MAS4 and breast health index from the multitrait analysis. The results of the within-family analysis are shown in Table 17.
[0624] Table 17
[0625] Significant QTLs obtained from family analysis using regression analysis for BTA1
[0626] Chromosome
Chr
main character
Location
(Morgan)
livestock pedigree
book compilation
father's name
Childhood
state
p-value ...
Embodiment 2
[0630] BTA5
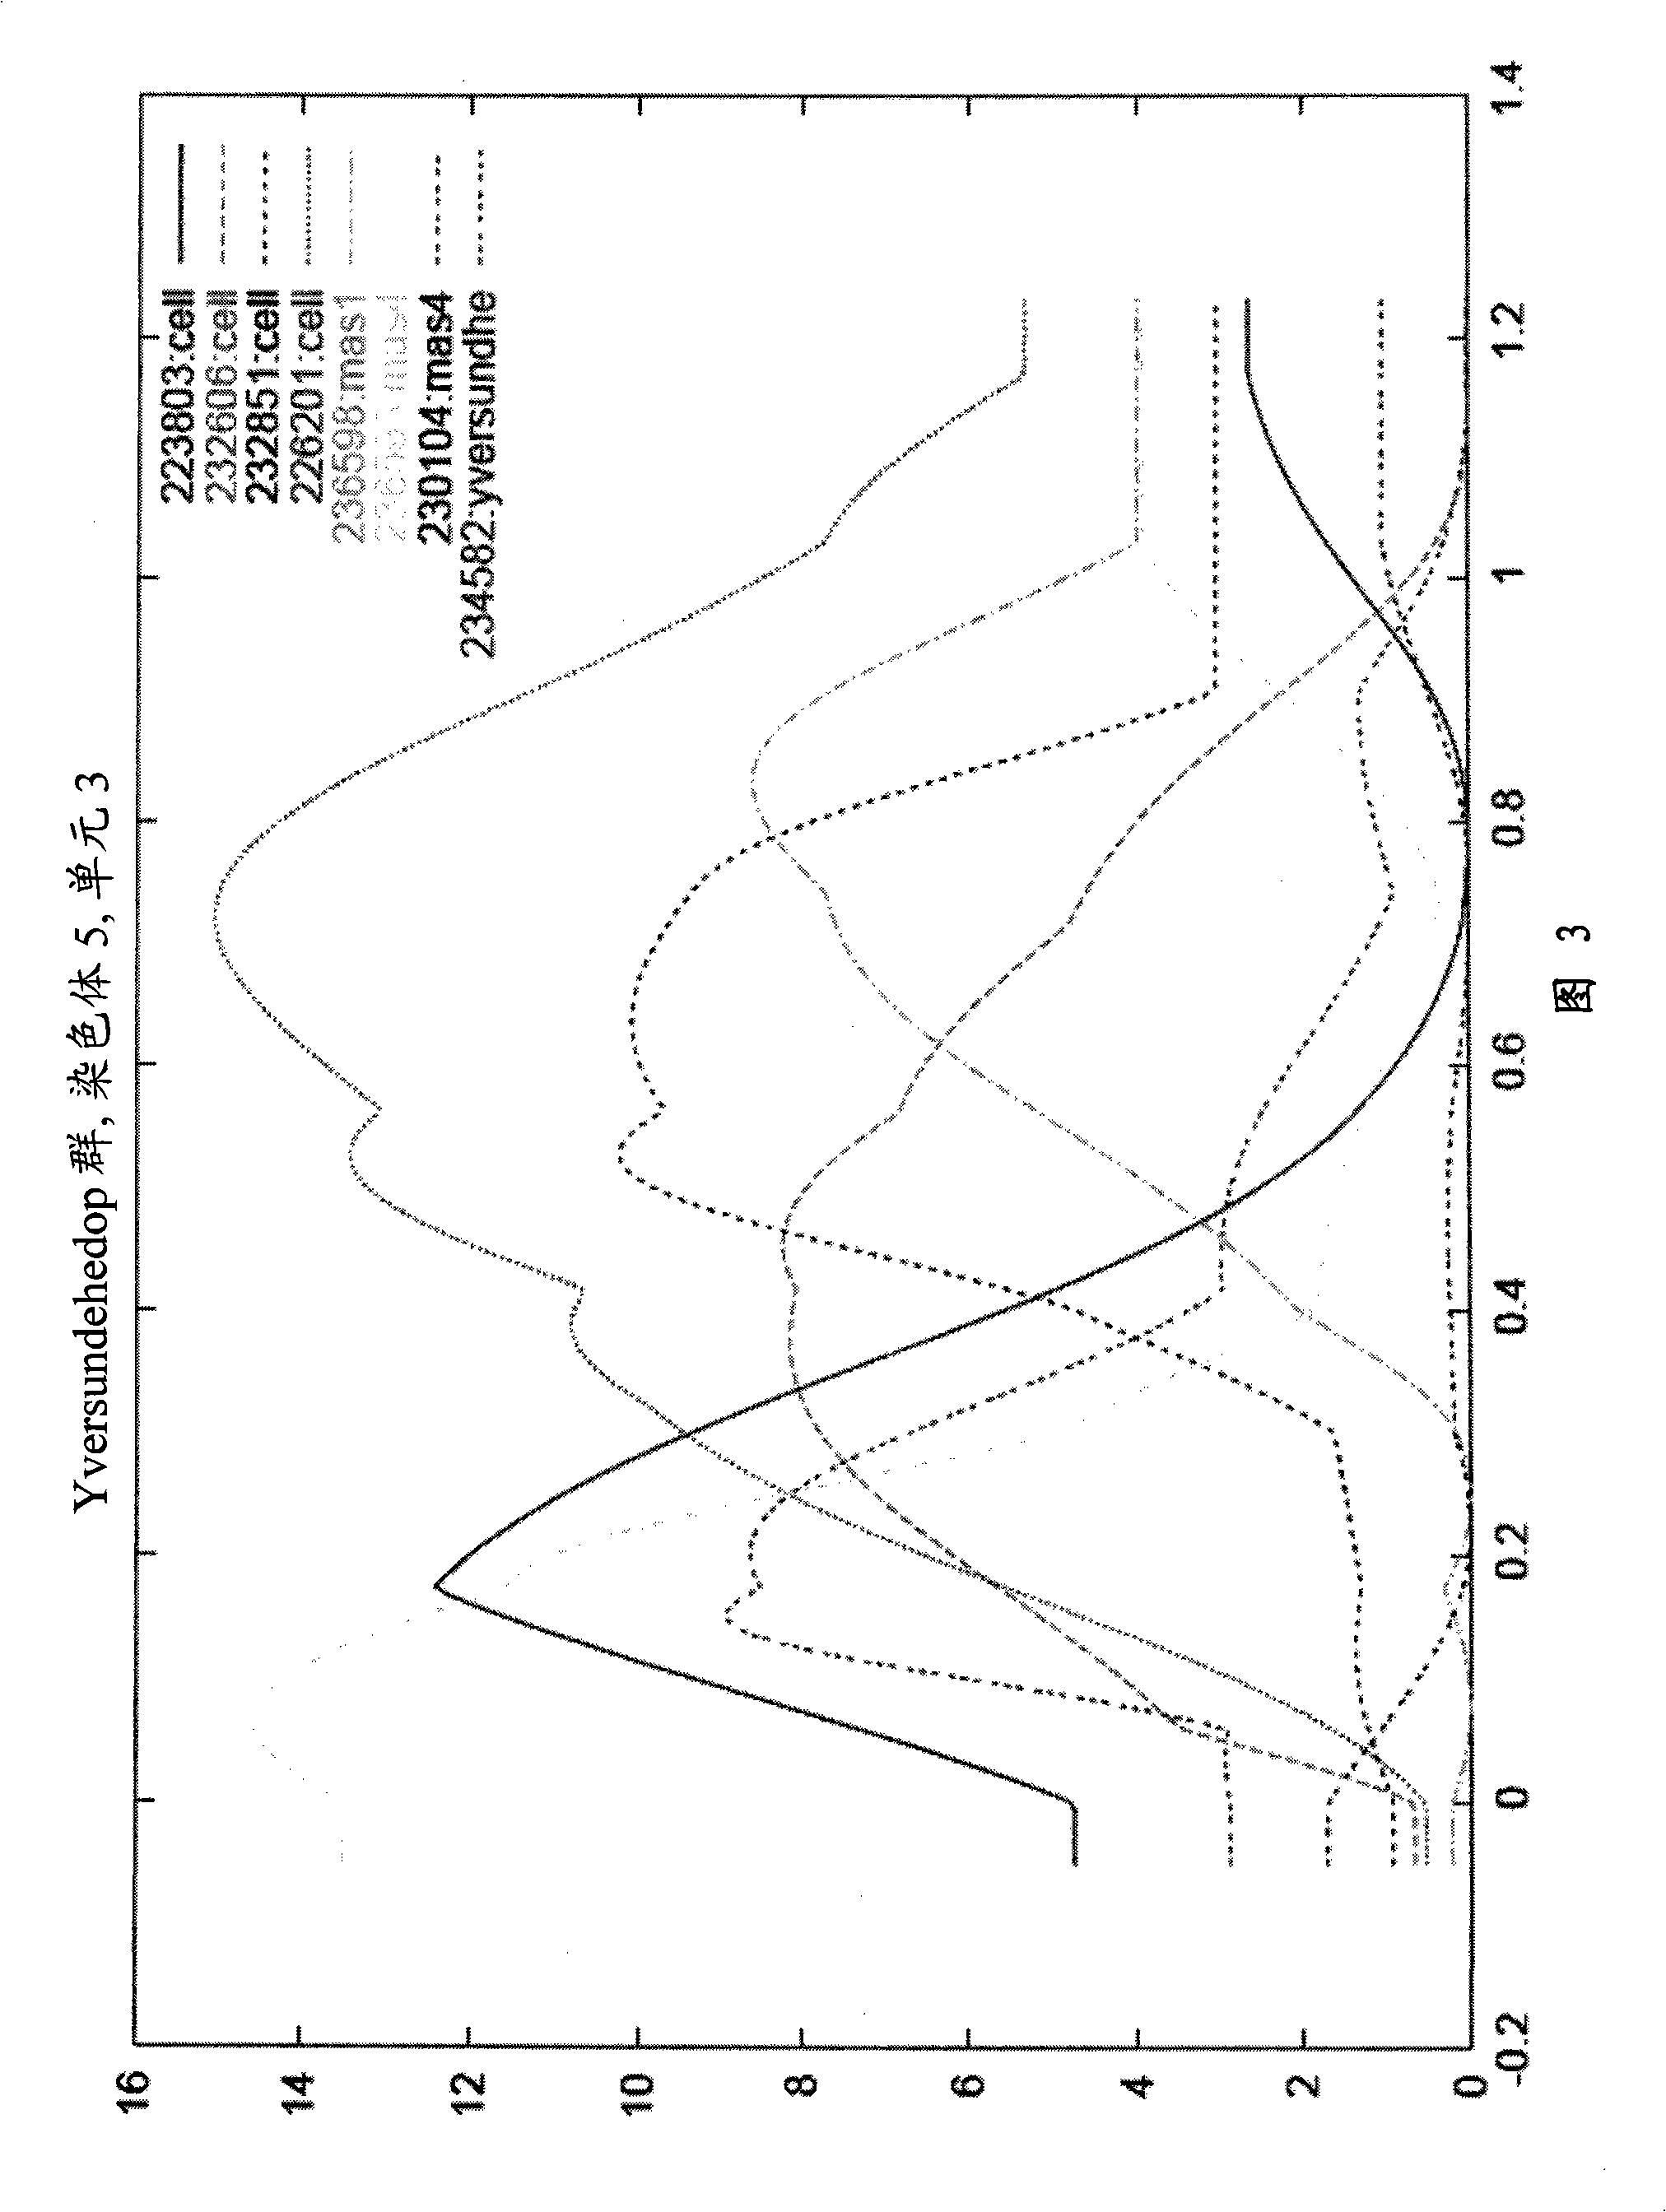
[0631] Table 18 lists the regression analysis structure for BTA5. Figures 3 and 4 show the QTL plots used in the regression analysis. The variance components method was used to detect cross-family QTLs for CELL, MAS1, MAS2, MAS3, MAS4, and breast health index in single-trait analysis (including all paternal families in one analysis). A significant QTL was detected in the cross-family analysis for CELL (likelihood ratio = 11.02 at position 0.44 mo). Three paternal families correspond to this QTL: 223803, 226201 and 232606. No significant QTLs were detected for MAS1, MAS2, MAS3, MAS4 and breast health index in the cross-family analysis. No signal was given for pleiotropic QTLs affecting the traits CELL, MAS1, MAS2, MAS3, MAS4 and breast health index from the multitrait analysis.
[0632] Table 18
[0633] Significant QTLs obtained from family analysis using regression analysis for BTA5
[0634] to dye
Body Chr
main character
Location...
Embodiment 3
[0638] BTA7
[0639] Table 19 lists the regression analysis structure for BTA7. Figure 5 and Figure 6 show the QTL plots used in the regression analysis. The variance components method was used to detect cross-family QTLs for CELL, MAS1, MAS2, MAS3, MAS4, and breast health index in single-trait analysis (including all paternal families in one analysis). A significant QTL was detected in the cross-family analysis of the breast health index (likelihood ratio = 18.9 at 0.75 mo). Four paternal families corresponded to this QTL: 236947, 226804, 230104 and 237017. No significant QTLs were detected for CELL, MAS1, MAS2, MAS3 and MAS4 in the cross-family analysis. No signal was given for pleiotropic QTLs affecting the traits CELL, MAS1, MAS2, MAS3, MAS4 and breast health index from the multitrait analysis.
[0640] Table 19
[0641] Significant QTLs obtained from family analysis using regression analysis for BTA7
[0642] Chromosome
Chr
main character
L...
PUM
 Abstract
Description
Claims
Application Information
 - R&D
- Intellectual Property
- Life Sciences
- Materials
- Tech Scout
- Unparalleled Data Quality
- Higher Quality Content
- 60% Fewer Hallucinations
Browse by: Latest US Patents, China's latest patents, Technical Efficacy Thesaurus, Application Domain, Technology Topic, Popular Technical Reports.
© 2025 PatSnap. All rights reserved.Legal|Privacy policy|Modern Slavery Act Transparency Statement|Sitemap|About US| Contact US: help@patsnap.com


