
Automatic generation method for power distribution single-line diagram

An automatic generation, single-line diagram technology, applied in the field of automation, can solve problems such as work errors, information inconsistencies, errors, etc., to achieve the effect of easy computer programming, simple tasks, and clear goals

Inactive Publication Date: 2009-07-22
HANGZHOU DIANZI UNIV
View PDF0 Cites 34 Cited by
  • Summary
  • Abstract
  • Description
  • Claims
  • Application Information

AI Technical Summary

Problems solved by technology

Power distribution one-line diagrams are used by many departments such as power supply enterprise planning, design, automation, dispatching, production management, operation management, and power marketing. Their respective maintenance will cause repeated labor or computer system expenses. Once the drawing is inconsistent with the actual power grid, or each function The drawing information used by the department is not synchronized or the information is inconsistent, which may cause work mistakes or even major mistakes

Method used


Image

  • Automatic generation method for power distribution single-line diagram
  • Automatic generation method for power distribution single-line diagram
  • Automatic generation method for power distribution single-line diagram

Examples


Embodiment Construction

[0027] The present invention will be further described below in conjunction with the accompanying drawings and examples of implementation.

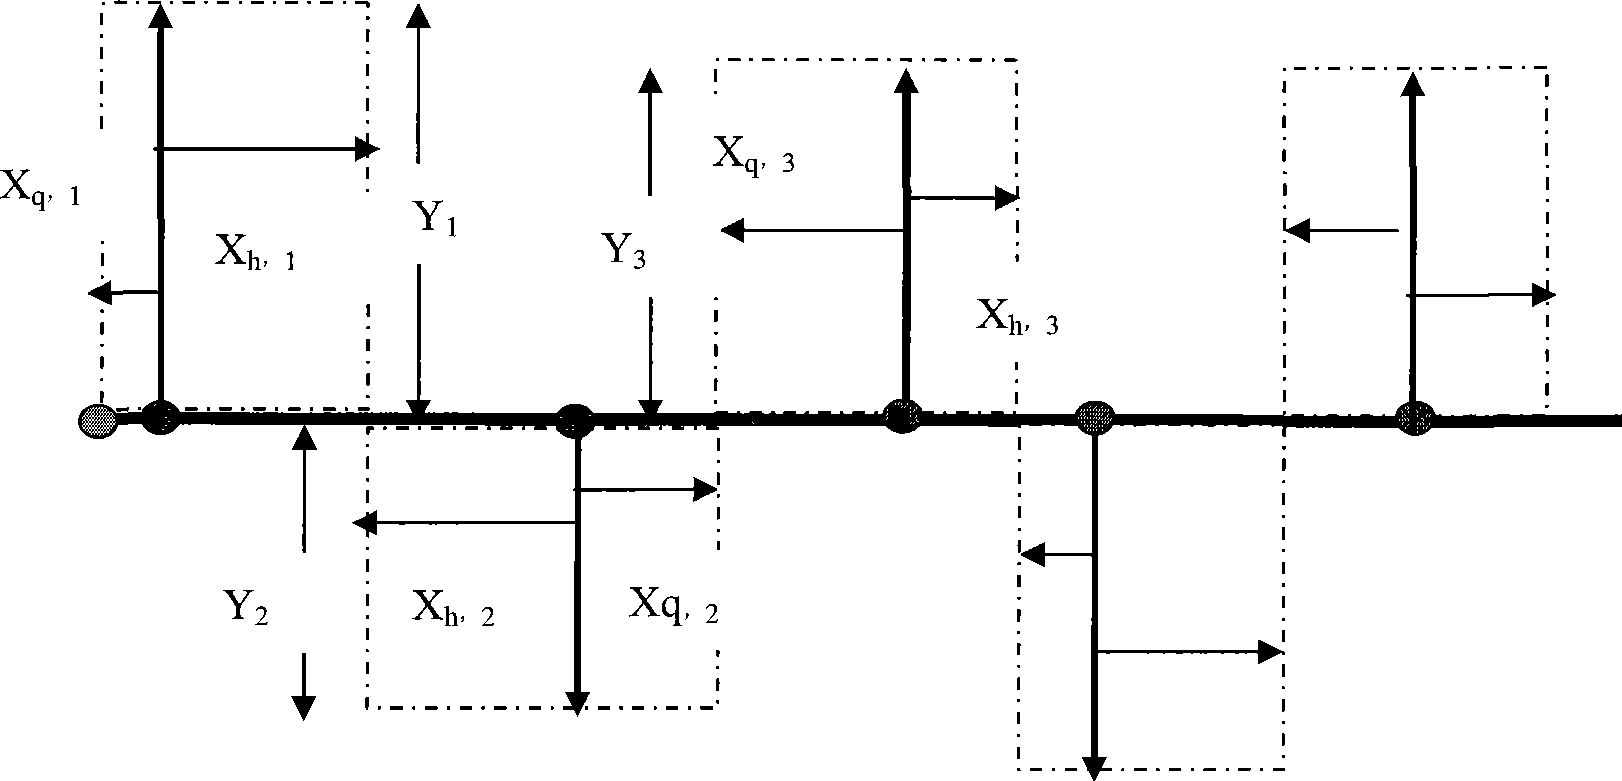
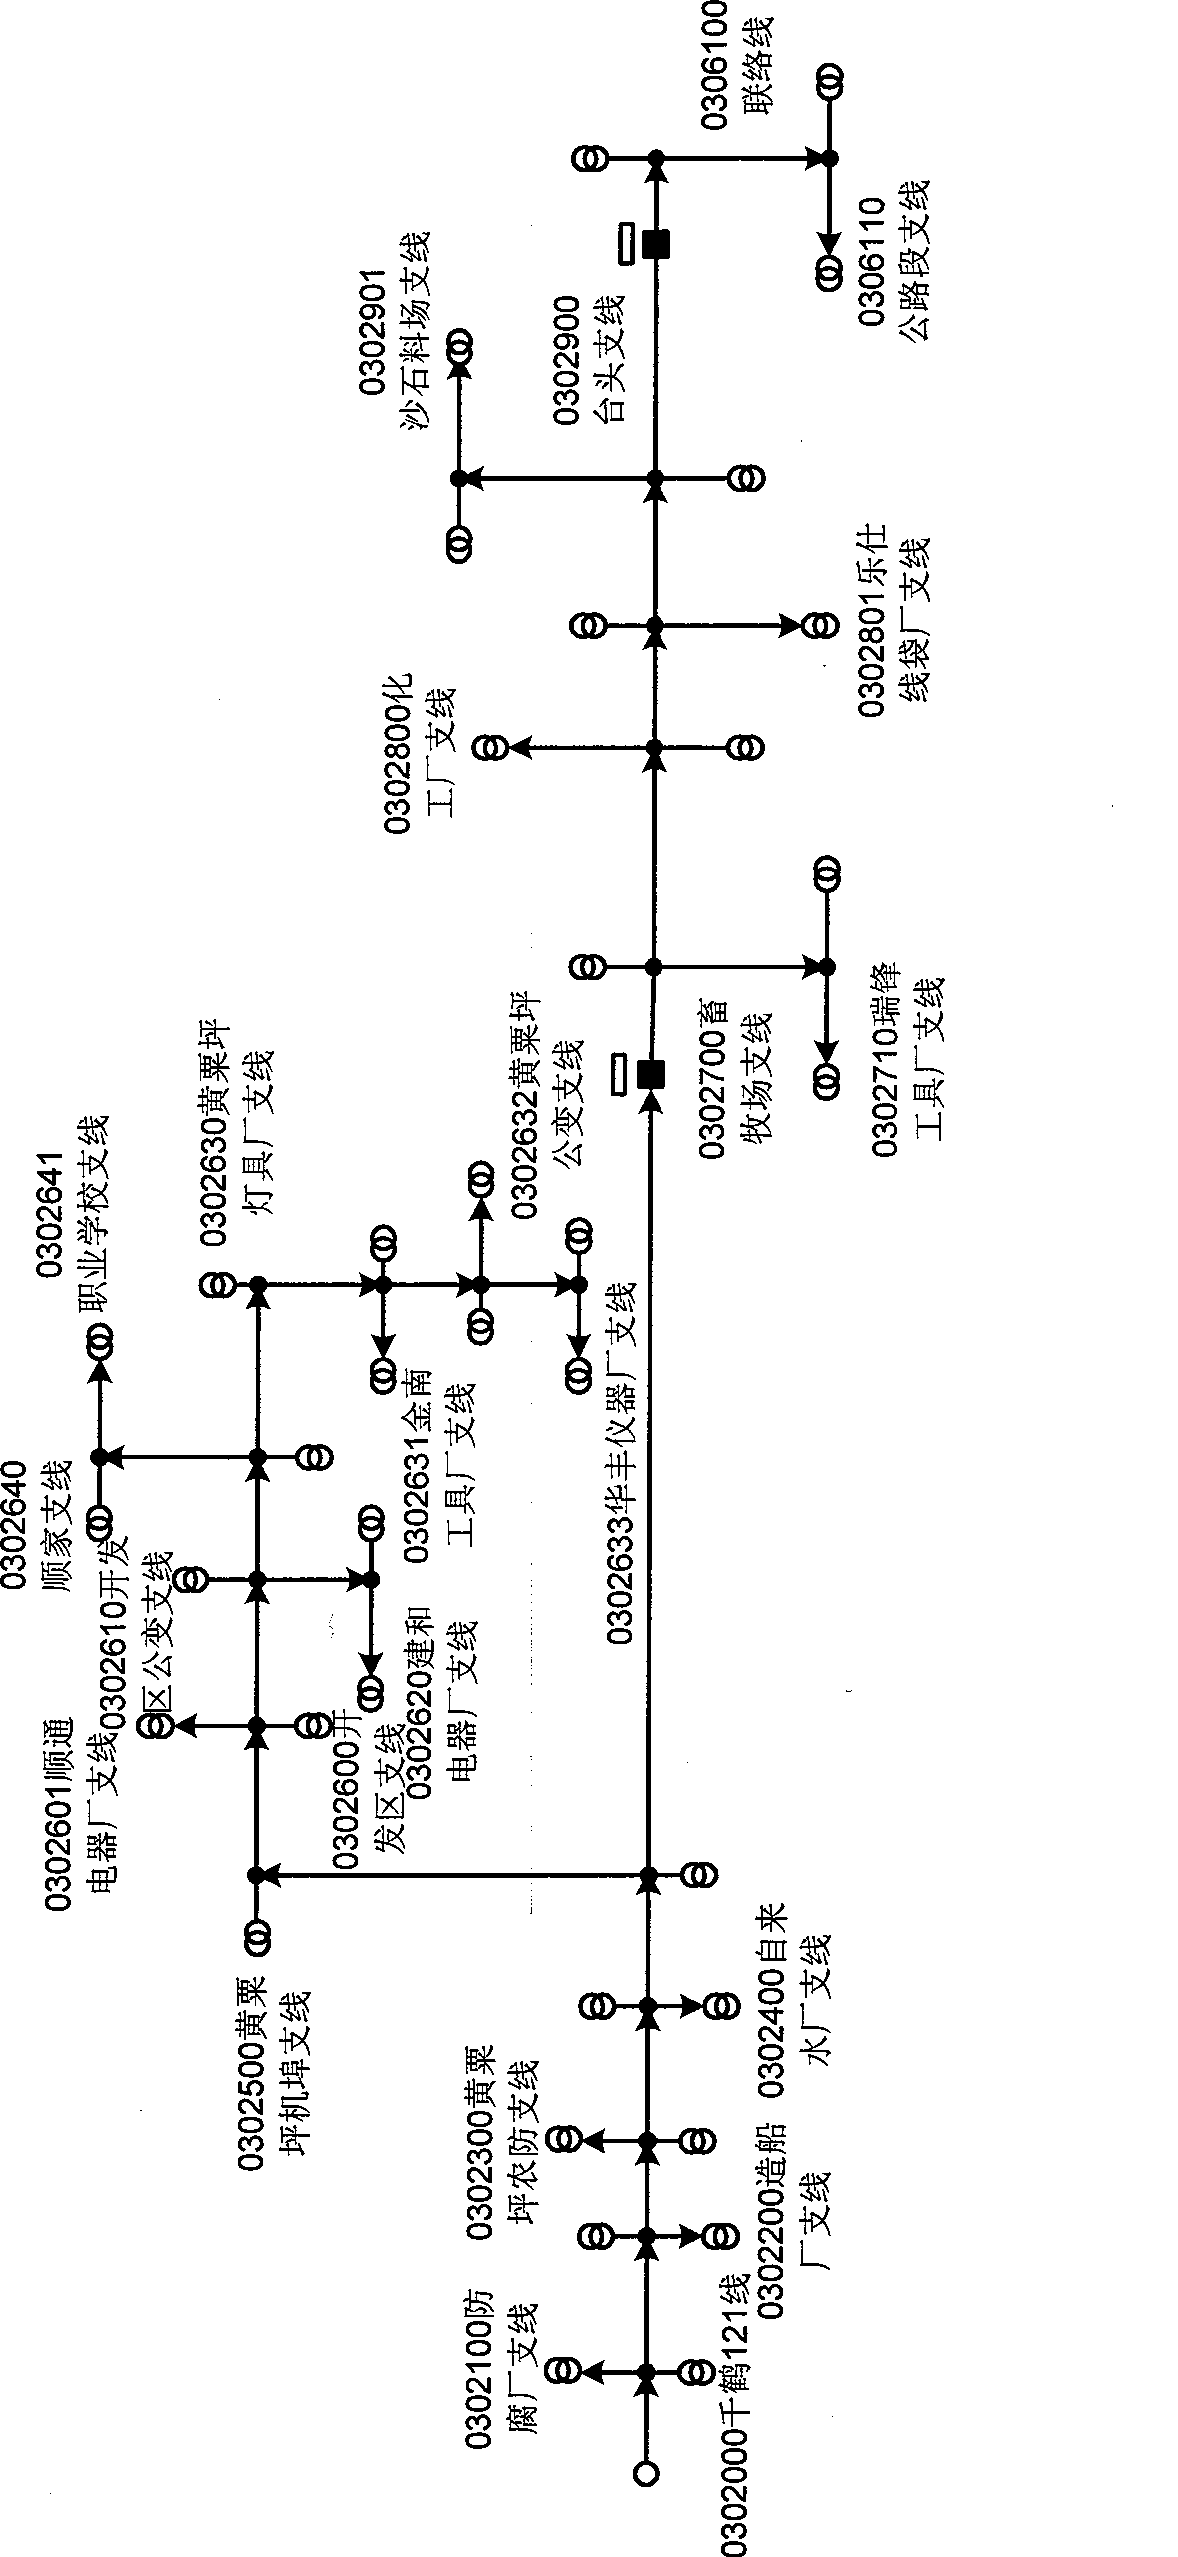
[0028] Such as figure 1 , the automatic generation method of power distribution one-line diagram: select the longest line from the feeder exit of the substation or the line with the most branches as the 0-level main line, set its branch line level as 0, place the main line horizontally, and connect to the 0-level main line The branch level of the branch line is 1; from front to back, the branch lines with the branch line level of 1 are arranged on the upper and lower sides of the 0-level main line at intervals, and are perpendicular to the 0-level main line, and the branch lines with an odd number of access sequence j are arranged at 0 On the upper side of the level trunk line, the branch lines with an even number of access sequence j are arranged on the lower side of the level 0 trunk line; the space S occupied by each level 1 branch lin...


PUM


Abstract

The invention relates to a power distribution single line graph automatic generating method. Currently, a power distribution single line graph is drawn manually, and the manual method has the disadvantages of large strength and large error probability and is not applicable to single line graphs with complex wiring. The method of the invention adopts trunk meta objects and branch meta objects with automatic picture composition elements under a grading trunk / branch power distribution data model based on arrangement rules of conventional power distribution single line graphs. And the two basic metas compose a recursive graph describing model, the graph parameter recognition is carried out gradually upward from the lowest grade, sub-graphs are generated and assembled grade by grade to generate whole feeder graphs at last, and the grade-by-grade generated graphs occupy space independently. The sub-graph of every branch all occupies space independently, and no overlapping possibility exists among the sub-graphs of the branches. The power distribution single line graph automatic generating method has the advantages of simple tasks and definite targets and is easy for computer programming.

Description

technical field [0001] The invention belongs to the technical field of automation, and relates to a graphical model of a feeder single-line diagram of a power distribution network system, in particular to a method for automatically forming a diagram from the primary equipment of the power distribution system and its connection relationship using hierarchical trunk line / branch line model data to realize the feeder single-line diagram Automatic generation of diagrams. Background technique [0002] The power distribution network system mainly refers to the power system composed of the power system voltage level of 6-10kV lines and switches, distribution transformers and other primary equipment. The distribution network system is the electricity network with the widest geographical coverage for direct customers of electricity consumption. It is the last link of power system generation, transmission, transformation, distribution, and use. It is directly related to the realization...

Claims


Application Information

Patent Timeline
Patent Type & Authority Applications(China)
IPC IPC(8): G06F17/50
Inventor 章坚民
Owner HANGZHOU DIANZI UNIV
Learn More