Electric network power flow section visualization adjusting method based on transient stability calculation

A technology of transient stability and power flow section, applied in electrical components, circuit devices, AC network circuits, etc., can solve the problem of inability to intuitively observe the voltage and frequency change process of the sending and receiving terminals, the inability to grasp the state of the power grid as a whole, and the inability to observe the stability of the system. It can improve the efficiency of section adjustment and achieve the effect of high interaction.

Active Publication Date: 2011-09-14
CHINA ELECTRIC POWER RES INST +1
View PDF2 Cites 17 Cited by
  • Summary
  • Abstract
  • Description
  • Claims
  • Application Information

AI Technical Summary

Problems solved by technology

But there are the following deficiencies: it is impossible to observe the stability of the system during the power flow adjustment process, and to perform stability verification; it is impossible to directly observe the voltage and frequency changes in the dynamic process of the power grid at the sending and receiving end, and the method planners cannot grasp the state of the power grid as a whole

Method used


Image

  • Electric network power flow section visualization adjusting method based on transient stability calculation
  • Electric network power flow section visualization adjusting method based on transient stability calculation
  • Electric network power flow section visualization adjusting method based on transient stability calculation

Examples


Embodiment Construction

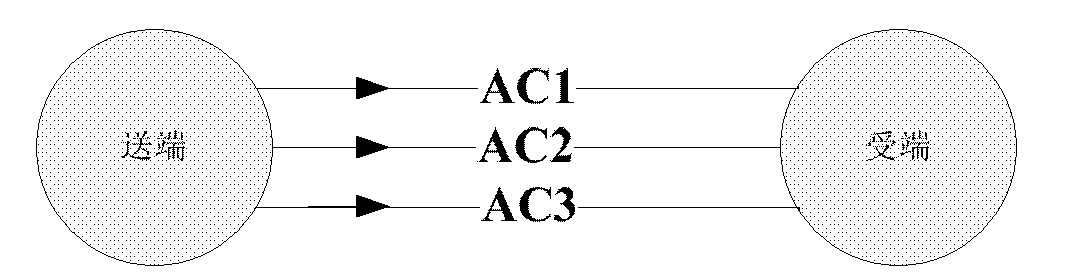
[0037] 1. Based on the calculation of transient stability, use a variety of display methods to visually display the voltage of the key bus points at the sending end and receiving end and the power value of the transmission section.

[0038] Grid status information display mode

[0039] Three-dimensional curved surface display grid status information

[0040] The three-dimensional surface mathematical model g(x, y)=z; the grid status information usually includes voltage, power and other information, and these information are displayed using the three-dimensional surface image, that is, x and y represent the coordinates of the proposed observation point in the power grid, and z represents the simulated The voltage value of the observation point; at the same time, the z value reflects the fluctuation of the three-dimensional surface, and the change of the information value of the observation point can be judged by observing the fluctuation of the surface;

[0041] Color disp...


PUM


Abstract

The invention provides an electric network power flow section visualization adjusting method based on transient stability calculation. Long-time simulation on an electric network is carried out based on a transient stability program; during the simulation process, a user sends the mode changing information to the transient stability simulation program by changing the running topology of the electric network or adjusting power generation, charges and the like at a sending end and a receiving end; the simulation program quickly responds to the change of the running mode of the electric network, calculates various state quantities of the electric network, obtains the transmission power of the power flow section in real time, and judges whether the section power achieves the adjusting target or not; furthermore, during the adjusting process, the stability of the system can be observed in real time; and the stability verification can be carried out. During the simulation process, various exhibiting modes are provided for carrying out visualized exhibition on a key busbar of the sending end and the receiving end, and the power value of the transmission section. By adopting the method that the user continuously operates and adjusts, the transient stability simulation program quickly responds, an interface exhibits section adjusting results visually and directly, the aim of adjusting and watching the section adjusting results and judging whether the result achieves the visualized adjusting method of the control target simultaneously can be achieved, the high interaction between the user and the simulation program is realized, and the section adjusting efficiency is improved.

Description

technical field [0001] The invention relates to power grid power flow section adjustment, in particular, provides a power grid power flow section visualization adjustment method based on transient stability calculation. Background technique [0002] Under certain conditions of the power grid structure, a transmission section composed of several lines can be selected, and the grid structure can be divided into a sending-end grid and a receiving-end grid through the section, such as figure 1 shown. [0003] Grid power flow section power regulation refers to the method of controlling the transmission power of the transmission section to reach the specified range by adjusting the operating parameters of the power grid, especially the power generation and load at the sending end and receiving end of the transmission section. Power flow section power control has become one of the goals of power grid calculation. There is already a power flow section control algorithm based on th...

Claims


Application Information

Patent Timeline
Patent Type & Authority Applications(China)
IPC IPC(8): H02J3/00H02J13/00H02B15/02
CPCY04S10/40
Inventor 裘微江徐得超李亚楼田芳崔立忠孙永锋邱健安宁赵敏
Owner CHINA ELECTRIC POWER RES INST
Why Eureka
Try Eureka