Customizable graph displaying method for level two-dimensional table

A two-dimensional table, layered technology, applied in special data processing applications, instruments, electrical digital data processing, etc., can solve the problems that users cannot define themselves, lack versatility, and power users cannot visualize the contents together.

Inactive Publication Date: 2012-04-04
NR ELECTRIC CO LTD +1
View PDF0 Cites 5 Cited by
  • Summary
  • Abstract
  • Description
  • Claims
  • Application Information

AI Technical Summary

Problems solved by technology

This method limits the data source and display form, which cannot be defined by the user and lacks versatility
[0005] 2) Some of the existing software can be displayed on the graphics system by drawing tables and selecting data sources, but only limited to viewing single-table data with tiled tables
Although the drawing flexibility is high, it is impossible to achieve multi-level data presentation, let alone the complex processing of merging intermediate levels
[0006] 3) Some existing software can support the data display of any level of two-dimensional table structure in a database, but this is the interface and data display on the general level of the database, and it is not integrated with the graphics platform of the EMS system and the substation monitoring system to provide visualization Controls, power users cannot organize this and other visual content together to form a highly integrated operating platform
[0007] Therefore, at present, there is no flexible configurable and customizable graphical hierarchical two-dimensional table display means on other power software graphics platforms

Method used


Image

  • Customizable graph displaying method for level two-dimensional table
  • Customizable graph displaying method for level two-dimensional table
  • Customizable graph displaying method for level two-dimensional table

Examples


Embodiment Construction

[0054] Below in conjunction with accompanying drawing and specific embodiment the present invention will be further described:

[0055] 1. Prerequisites

[0056] The present invention is realized based on a real-time object database, which is a completely object-oriented real-time database management system, supports inheritance, simple connection and aggregation relationship between classes, can construct complex data structures, and can support multi-layer retrieval conditions data access. For the detailed introduction of the real-time object database, please refer to "Real-time Object Database Management System Supporting CIM" [J], Electric Power System Automation, 2006.30(16): 93-96 and other documents.

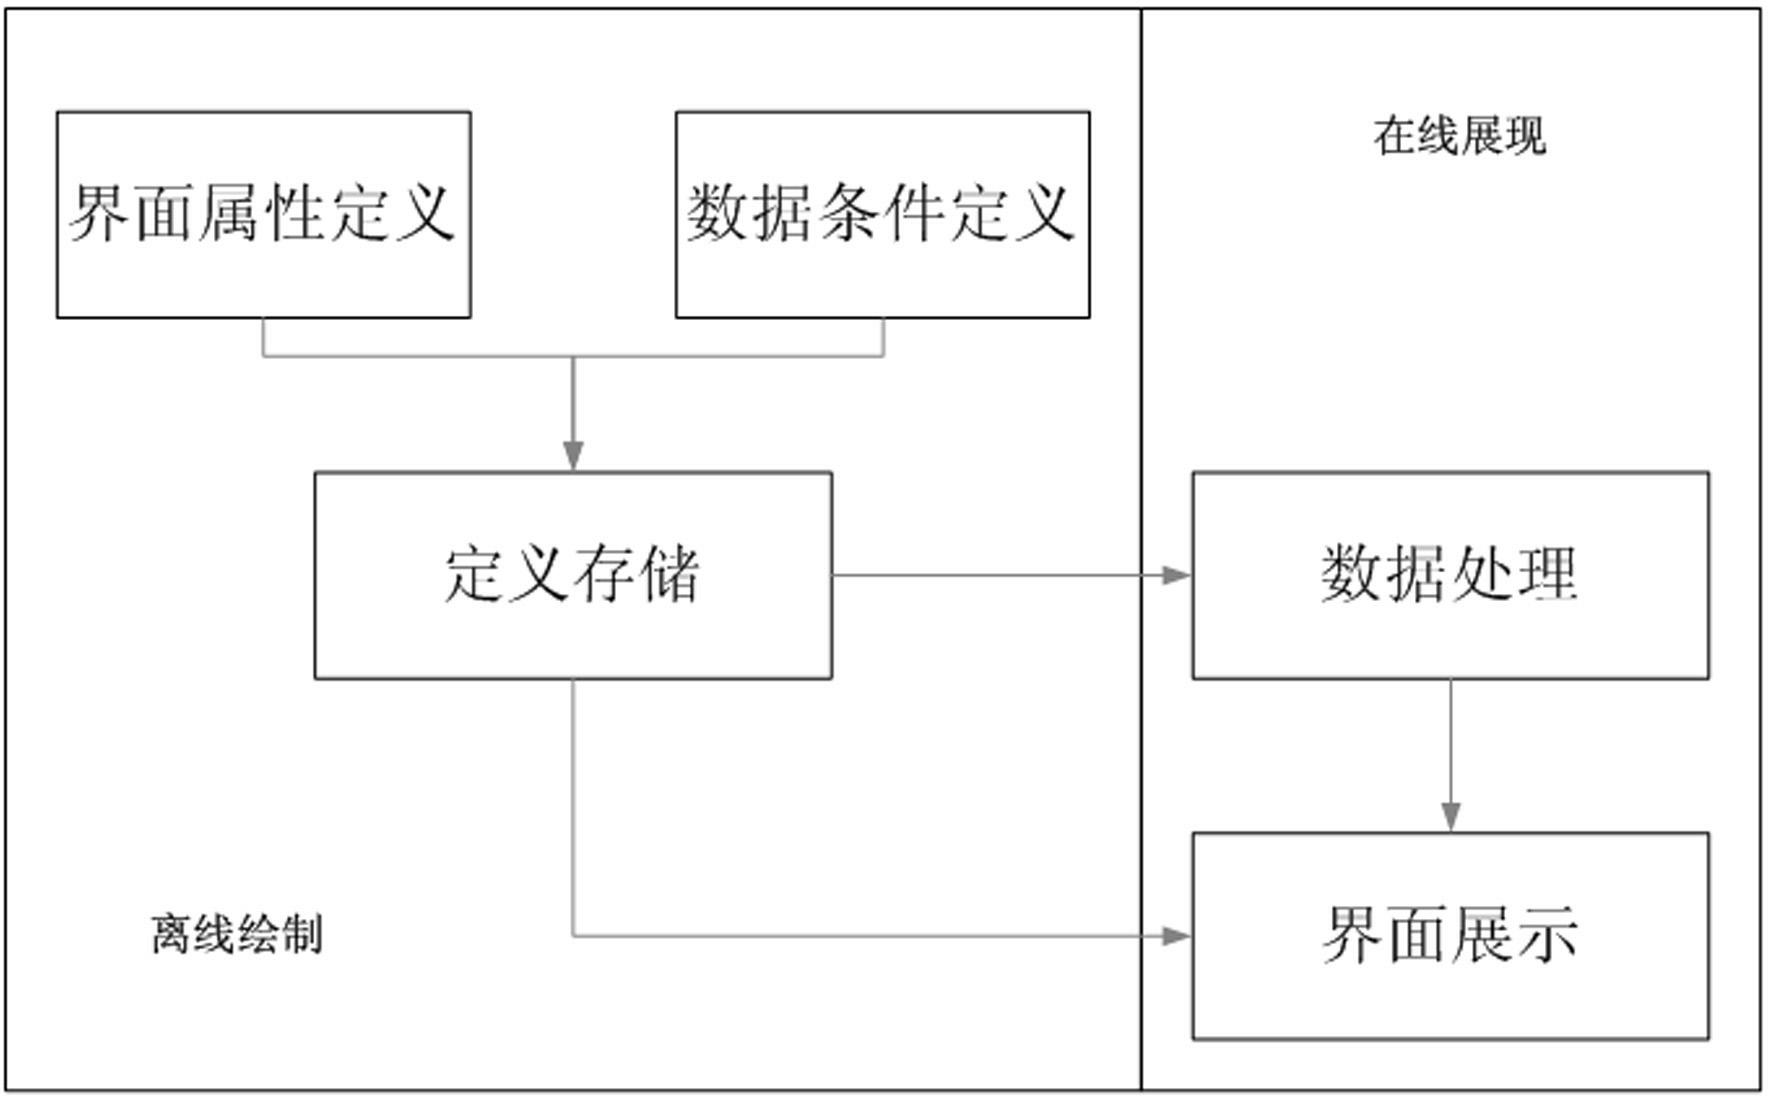
[0057] 2. Interface design and main work links (such as figure 1 )

[0058] The hierarchical two-dimensional table is displayed in the form of a screen, which can be divided into the following display areas: upper title bar, left title bar, tree directory structure, d...


PUM


Abstract

The invention relates to a customizable graph displaying method for a level two-dimensional table, which is applied to graphics systems of electricity software, such as an EMS (energy management system), a transformer substation monitoring system and the like. The customizable graph displaying method for the level two-dimensional table comprises the following steps: in a graphics system of the EMS or the transformer substation monitoring system, applying a level two-dimensional table graph control thereof to customize data sources of the level two-dimensional table through level condition retrieval character strings, and adopting a graph drawing manner to display the level two-dimensional table. Due to the utilization of the invention, visualized display of objectification data of a complex level structure by adopting a customized manner in the graph system can be realized, and the problem that in the prior art, a user can not directly customize and display the information content is changed.

Description

technical field [0001] The method relates to a customizable graphical display mode of object-oriented hierarchical information. Especially in the power graphics system, various complex model structures such as IEC61850, IEC61970, network node monitoring, etc. can be intuitively displayed in the form of tables in the graphics. Background technique [0002] In the power EMS system, users often use graphical customization to establish the operation interface of the dispatching operation system, and all operation information is centralized and organized in this graphical operation interface. However, in real systems, the structure of the power information model is becoming more and more complex, and the content of the graphical interface is becoming more and more abundant. For model data with object-oriented hierarchical relationships, users often need to be able to view all the information of a certain topic in one table. [0003] The graphical display method of hierarchical ...

Claims


Application Information

Patent Timeline
IPC IPC(8): G06F17/30
Inventor 戴春潮唐晓莉姜彬
Owner NR ELECTRIC CO LTD
Why Eureka
Try Eureka