Quality analysis data processing method and quality analysis data processing system

A mass analysis and data processing technology, applied in the field of data processing of imaging mass spectrometers, can solve the problems such as the inability of compressed mass analysis data to maintain backward compatibility, the decline of data compression efficiency, and the inability to read compressed data correctly.

Inactive Publication Date: 2015-09-09
SHIMADZU SEISAKUSHO CO LTD
View PDF3 Cites 0 Cited by
  • Summary
  • Abstract
  • Description
  • Claims
  • Application Information

AI Technical Summary

Problems solved by technology

However, in the method for embedding index information at certain intervals in compressed data, it is necessary to perform run-length encoding (or similar compression processing) for each part separated by the index, which leads to a decrease in data compression efficiency
Furthermore, compressed data with index information embedded cannot be read correctly by systems designed to read compressed data without expecting the presence of index information in the data
That is, the embedding of index information makes some existing systems not backward compatible for compressing quality analysis data

Method used


Image

  • Quality analysis data processing method and quality analysis data processing system
  • Quality analysis data processing method and quality analysis data processing system
  • Quality analysis data processing method and quality analysis data processing system

Examples


Embodiment Construction

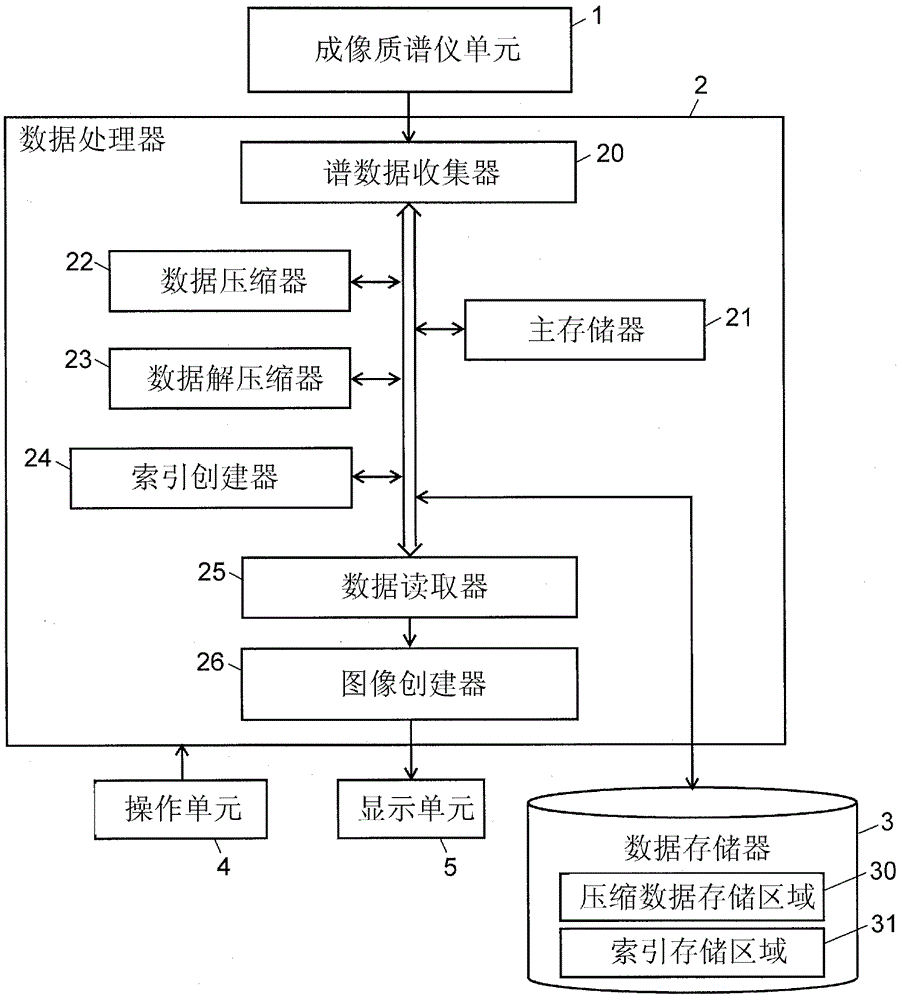
[0084] An embodiment of a mass analysis data processing method according to the present invention and a mass spectrometer using the method will be described below with reference to the drawings.

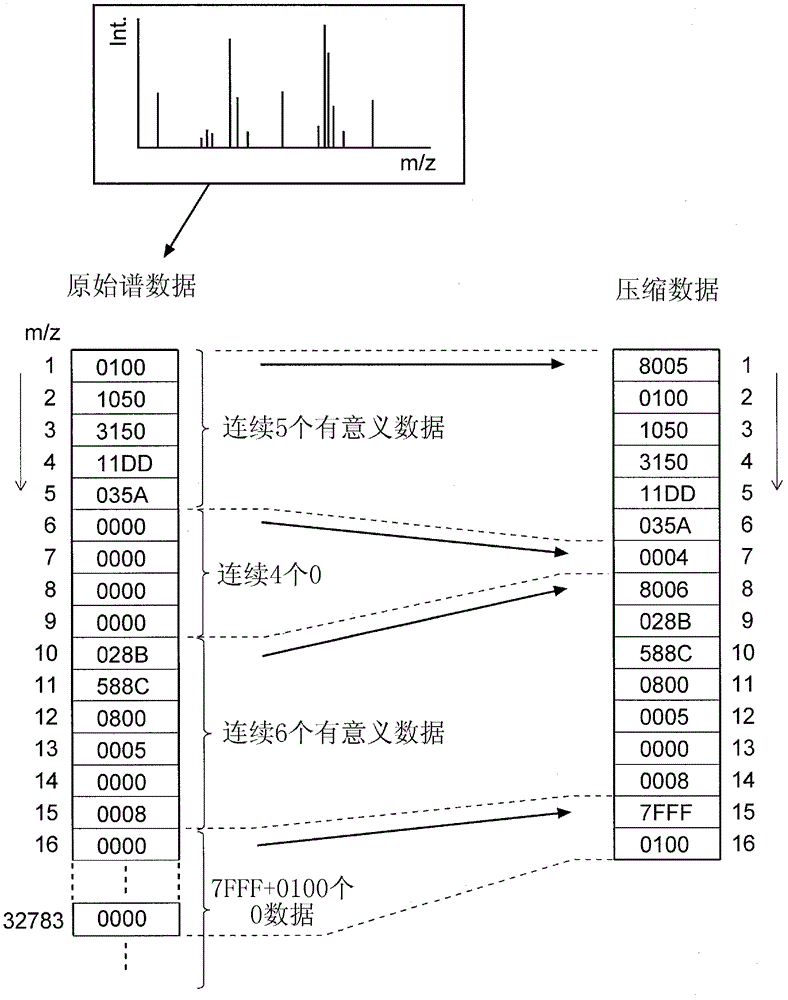
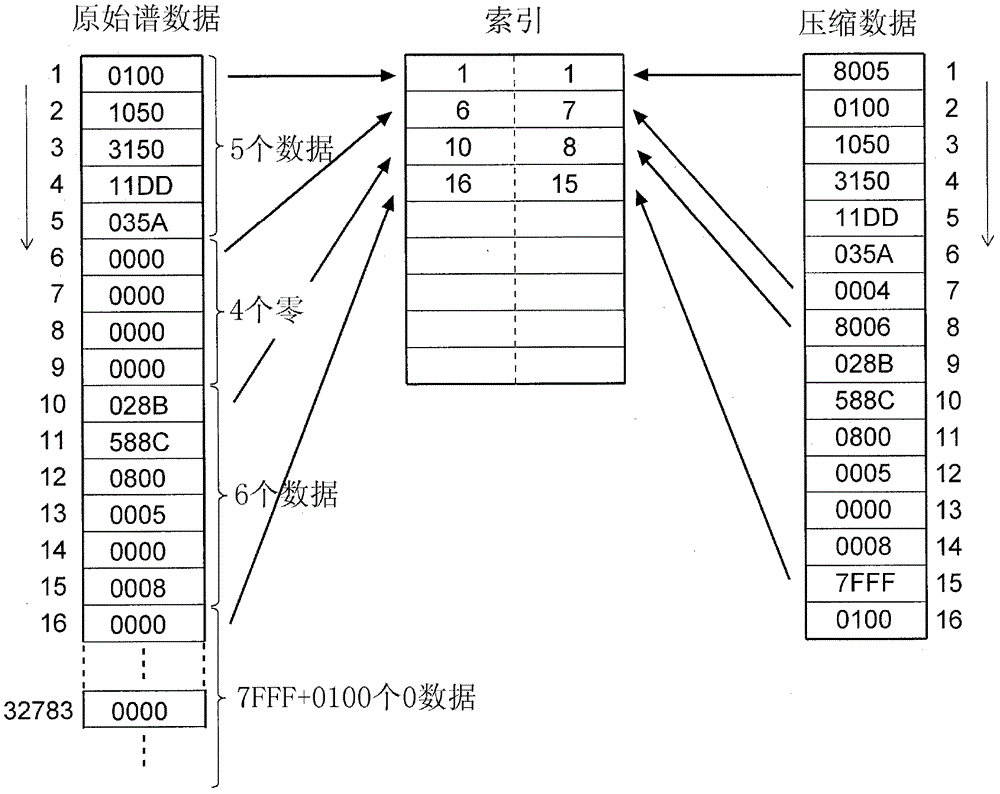
[0085] first reference Figure 2 to Figure 5 A mass analysis data processing method according to one embodiment of the present invention will be described. figure 2 is a diagram showing an example of data compression processing in the mass analysis data processing method according to the present embodiment, and image 3 is a diagram showing an example of index creation processing in the mass analysis data processing method according to the present embodiment.

[0086] The following describes the case of compressing a set of data constituting a mass spectrum, wherein the axis of abscissa represents the mass-to-charge ratio m / z, and the axis of ordinate represents the signal intensity, such as figure 2 shown above. Each spectrum data corresponding to a mass-to-charge ratio is 2-by...


PUM


Abstract

Provided is a method for quickly obtaining an intensity value at a desired m / z value in a compressed data obtained by run-length encoding of a mass analysis data. An index is created by pairing either the start position of a section where zero-intensity consecutively occurs two or more times in an array of an original spectrum data, or the start position of a sequence of data having significant intensity values in an array of the original spectrum data, with the corresponding position in an array of a compressed data. This index is stored separate from the compressed data. The creation of the index does not affect the array of the compressed data. Therefore, the data can be decompressed even by a data processing system that does not use the index. The index helps to quickly locate a compressed data corresponding to the desired m / z and obtain the necessary intensity value.

Description

technical field [0001] The present invention relates to a method for processing data collected by mass analysis, and in particular to an image adapted to be able to acquire an image showing the distribution of signal intensities of a specific mass-to-charge ratio within a two-dimensional area on a sample ( Hereinafter, this image will be referred to as a "mass analysis result image") in the data processing method of the imaging mass spectrometer. The invention also relates to a mass spectrometer using this method. Background technique [0002] Mass spectrometry imaging is a technique for studying the distribution of a substance having a specified mass-to-charge ratio (m / z) by performing mass analysis on a plurality of minute regions within a two-dimensional region of a sample such as a piece of biological tissue, respectively. This technology is expected to be used, for example, in drug discovery, biomarker discovery, and etiological investigation of various diseases. Mass...

Claims


Application Information

Patent Timeline
Patent Type & Authority Patents(China)
IPC IPC(8): H01J49/00H03M7/30
CPCH03M7/3059H01J49/0036H01J49/0004
Inventor 池上将弘
Owner SHIMADZU SEISAKUSHO CO LTD
Why Eureka
Try Eureka