Three-dimensional visualization simulation method directed at boundary element analysis

A boundary element and three-dimensional technology, applied in the field of three-dimensional visualization and simulation, can solve the problems of inability to meet the requirements of viewing angle changes such as overall viewing of the model and partial zoom-in, insufficient display of model geometric information and numerical information, and limitations in application fields, etc., to achieve good practical results. Engineering application value, high-speed real-time rendering, and wide application prospects

Active Publication Date: 2013-01-30
DALIAN UNIV OF TECH
View PDF3 Cites 24 Cited by
  • Summary
  • Abstract
  • Description
  • Claims
  • Application Information

AI Technical Summary

Problems solved by technology

[0005] 1. The boundary element analysis method divides the model mesh into triangular units, and the finite element analysis has many types of units. Therefore, the fast generation algorithm established by the above method is not the best for the processing results after the boundary element analysis. optimized
[0006] 2. The above method does not consider the establishment of the grid model, solid model and cloud image model under a single model when generating the 3D model, which cannot meet the complete functional requirements of post-processing 3D visualization
[0007] 3. The above method simply considers the generation of the model, but does not conduct relevant research on the 3D operation of the model, and cannot meet the user's requirements for viewing the model as a whole, zooming in on the model, etc. in the post-processing stage.
In addition, there is a lack of functions such as orientation indication of the current model coordinate system (establishment of the reference coordinate system), quick view switching, etc.
[0008] 4. The above method does not provide functions such as screen capture, cloud map numerical information display, and computer display status display. The display of model geometric information and numerical information is not enough, and the application field is relatively limited.

Method used


Image

  • Three-dimensional visualization simulation method directed at boundary element analysis
  • Three-dimensional visualization simulation method directed at boundary element analysis
  • Three-dimensional visualization simulation method directed at boundary element analysis

Examples


Embodiment Construction

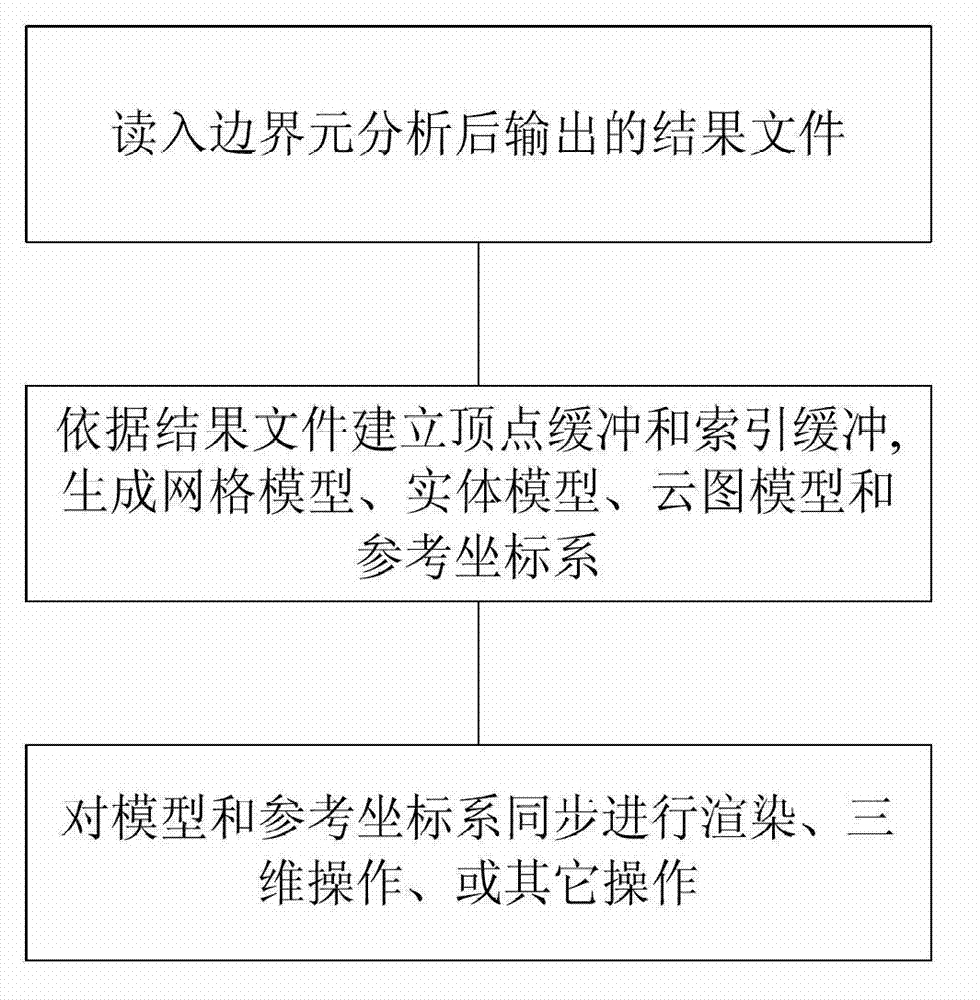
[0020] Such as figure 1 As shown, the three-dimensional visualization simulation method of the present invention comprises:

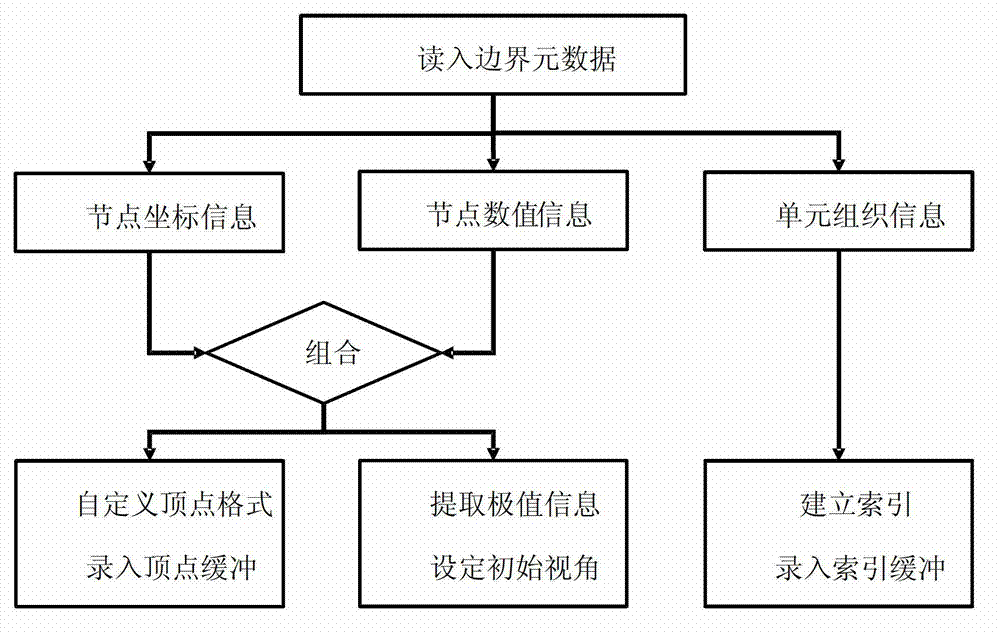
[0021] Step 1: Read in the result file output by the modeling software (such as: ANSYS, PATRAN, SESAM, etc.) after the boundary element analysis of the engineering project. The result file contains the model node coordinate information, unit organization information and node value information.

[0022] Step 2: Establish vertex buffer and index buffer, enter node coordinate information and node value information into vertex buffer, enter unit organization information into index buffer, generate grid model, solid model, cloud model and reference coordinate system, such as figure 2 shown. While establishing the vertex buffer, the extreme value information is also recorded. On the one hand, the extreme value information provides a basis for the establishment of the initial perspective, and on the other hand, it provides a data reserve for the cloud map nu...


PUM


Abstract

The invention discloses a three-dimensional visualization simulation method directed at boundary element analysis. The three-dimensional visualization simulation method comprises reading in result documents output after the boundary element analysis; establishing vertex buffers and index buffers, and recording node coordinate information and node numerical value information into the vertex buffers and unit organization information into the index buffers to generate grid models, entity models, cloud models and reference coordinate systems; and performing rendering, three-dimensional operation or other operation synchronously on the models and the reference coordinate systems. The method processes the result documents after the boundary element analysis, only fundamental information of construction models and clouds is needed to be input, no special requirement exists for formats, and common business engineering software of Ansys, Patran, Sesam and the like can be used for providing input information. The method has a flexible processing mechanism, wide applicability and good practical engineering application values.

Description

technical field [0001] The invention relates to a method for performing three-dimensional visual simulation on a pair of boundary element analysis processing results. Background technique [0002] In the field of engineering, it is often necessary to use finite element method or boundary element analysis method to realize the solution and analysis of discrete modules in complex systems, and the 3D visualization simulation method provides an interactive means for technicians to study and analyze results. [0003] The basic solution idea of ​​the finite element method is to divide the calculation domain into a finite number of non-overlapping units. In each unit, some suitable nodes are selected as the interpolation points of the solution function, and the variables in the differential equation are rewritten as The linear expression composed of the node value of its derivative and the selected interpolation function, with the help of the variational principle or weighted resid...

Claims


Application Information

Patent Timeline
Patent Type & Authority Applications(China)
IPC IPC(8): G06F17/50G06T17/00G06T15/00
Inventor 黄一王普施以航王文华
Owner DALIAN UNIV OF TECH
Why Eureka
Try Eureka