Design method of progressive addition ophthalmic lens
A technology for progressive multi-focal ophthalmic lenses, which is applied in glasses/goggles, optics, instruments, etc., and can solve the problem of insufficient flexibility of progressive multi-focal ophthalmic lenses
- Summary
- Abstract
- Description
- Claims
- Application Information
AI Technical Summary
Problems solved by technology
Method used
Image
Examples
Embodiment 1
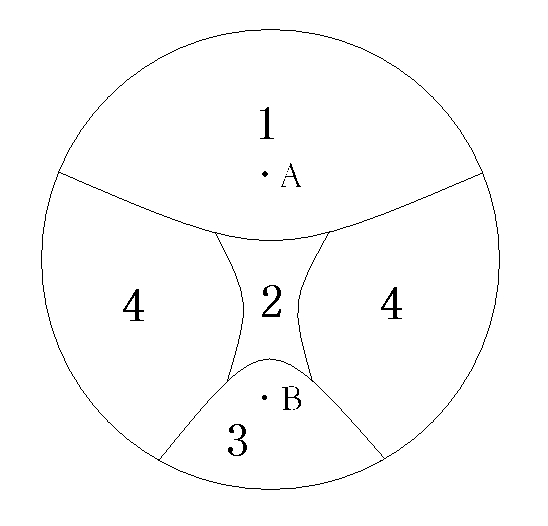
[0073] In this embodiment, the lens radius of the lens to be processed is R=36mm, and the refractive power of the far zone is 4 diopters, near vision It is 6 diopters, and the focal power of the lens is 2 diopters. Set the lens gradient channel length h=36mm, and the distance L from A to the lens center point O=18mm. The lens material has a refractive index of 1.523.
[0074] The lens design steps are as follows:
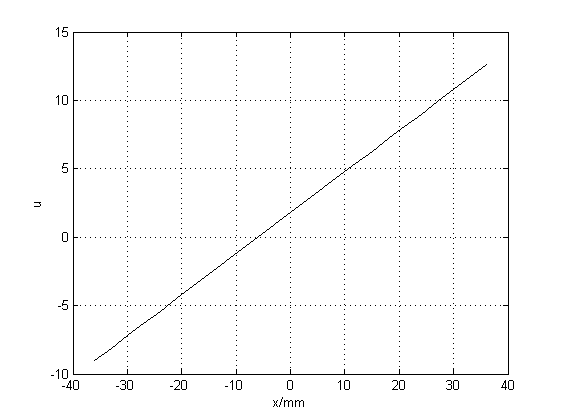
[0075] 1. The value of u at point A is , at point B is , the change form of u on the meridian is a straight line. The boundary around the square u is in the form of a straight line boundary, where the sides are straight lines with a certain slope: .
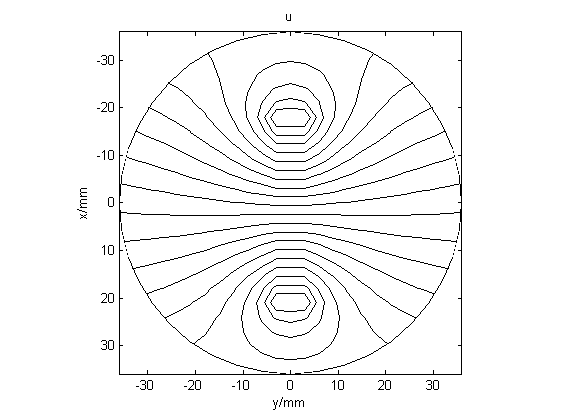
[0076] Such as figure 2 As shown in the figure, the abscissa is the longitudinal coordinate of the lens, and the value of the ordinate is u. The top and bottom connect the two sides with a straight line, and the contour cluster is obtained by numerically solving the Laplace equation Contours such as ...
Embodiment 2
[0091] In this embodiment, lens parameters and design steps are the same as those in Embodiment 1. The difference is that in step 2, the boundary conditions around the u square are in the form of curved boundaries, and the four sides are all polynomials. Figure 8 are the boundary curves for the top, bottom and side edges, Figure 9 Contour plot of u obtained for solving Laplace's equation. Figure 10 is the three-dimensional grid map of the focal power distribution of the lens, Figure 11 , Figure 12 Respectively, the focal power distribution and astigmatism distribution diagram of the lens.
[0092] From Figure 9 It can be seen from the u contour line in the figure that the u contour line in the far-sighted area is flatter and wider than the u contour line in the near-sighted area. From this embodiment, the lens focal power three-dimensional grid map ( Figure 10 ) and focal power contour map ( Figure 11 ), it can be seen that the focal power of the far viewing ar...
Embodiment 3
[0094] In this embodiment, lens parameters and design steps are the same as those in Embodiment 1. The difference is that the change form of u between the reference point A of the far-sighted area and the reference point B of the near-sighted area on the meridian is a Gaussian curve, such as Figure 13 shown. The boundary conditions around the u square are in the form of curved boundaries, and the four sides are polynomials.
[0095] Figure 14 are the boundary curves for the top, bottom and side edges, Figure 15 Contour plot of u obtained for solving Laplace's equation. Figure 16 is the three-dimensional grid map of the focal power distribution of the lens, Figure 17 , Figure 18 Respectively, the focal power distribution and astigmatism distribution diagram of the lens.
[0096] From Figure 13 The change form of u between the reference point A of the far-sighted area and the reference point B of the near-sighted area on the neutron meridian is a Gaussian curve. T...
PUM
| Property | Measurement | Unit |
|---|---|---|
| Length | aaaaa | aaaaa |
Abstract
Description
Claims
Application Information
 - R&D
- Intellectual Property
- Life Sciences
- Materials
- Tech Scout
- Unparalleled Data Quality
- Higher Quality Content
- 60% Fewer Hallucinations
Browse by: Latest US Patents, China's latest patents, Technical Efficacy Thesaurus, Application Domain, Technology Topic, Popular Technical Reports.
© 2025 PatSnap. All rights reserved.Legal|Privacy policy|Modern Slavery Act Transparency Statement|Sitemap|About US| Contact US: help@patsnap.com


