
Virtual terminal graphical display method of field debugging of intelligent transformer substation

A smart substation and graphical display technology, applied in the field of power systems, can solve problems such as low data utilization, data waste of manpower, and single function, and achieve the effects of improving utilization, saving manpower and material resources, and reducing burdens

Active Publication Date: 2014-05-07
SHANDONG ELECTRIC POWER TRANSMISSION & SUBSTATION ENG CO
View PDF2 Cites 11 Cited by
  • Summary
  • Abstract
  • Description
  • Claims
  • Application Information

AI Technical Summary

Problems solved by technology

[0004] At present, the on-site commissioning of smart substations mainly adopts the cable card printing scheme and the virtual terminal configuration scheme. These two schemes complete the single function of printing and display by collecting part of the information in the commissioning process. In the above scheme, when making the cable laying label, It is necessary to collect the information of about 4,000 cables and 20,000 connections in the entire station when making cable tags, making wire core marks, and checking cable information. It will be a huge workload if the information is collected repeatedly.
In the debugging process, if you want to get the information of a certain cable or virtual terminal, you can only slowly look at the drawings, and you cannot use the statistical function of the computer to quickly get the required information, such as the screen cabinet related to a certain screen cabinet, the distance between two screen cabinets, etc. All cables, routing of all 4 square cables, etc.
Therefore, the existing solutions have the following disadvantages: single function, repeated collection of data wastes manpower, low data utilization, and inability to check data against each other to find drawing errors

Method used


Image

  • Virtual terminal graphical display method of field debugging of intelligent transformer substation
  • Virtual terminal graphical display method of field debugging of intelligent transformer substation
  • Virtual terminal graphical display method of field debugging of intelligent transformer substation

Examples


Embodiment Construction

[0053] The present invention will be further described below in conjunction with accompanying drawing.

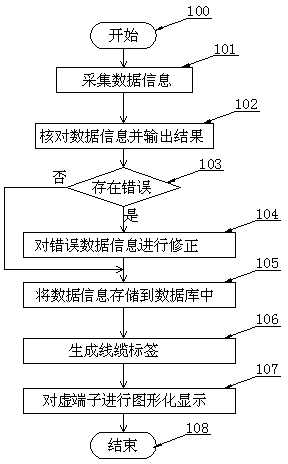
[0054] Such as figure 1 As shown in the present invention, a virtual terminal graphical display method for on-site commissioning of an intelligent substation comprises the following processes:

[0055] 100, work starts;

[0056] 101. Collect data information of virtual terminals, cables, optical cables and terminal wiring diagrams;

[0057] 102. Check the collected data information, and output the check result;

[0058] 103, whether there is an error in the data information, if yes, enter the next step, otherwise, proceed to step 105;

[0059] 104. Correct the wrong data information;

[0060] 105. Store the collected data information in a database;

[0061] 106. Generate a cable label;

[0062] 107. Graphically display the virtual terminal;

[0063] 108. The work is over.

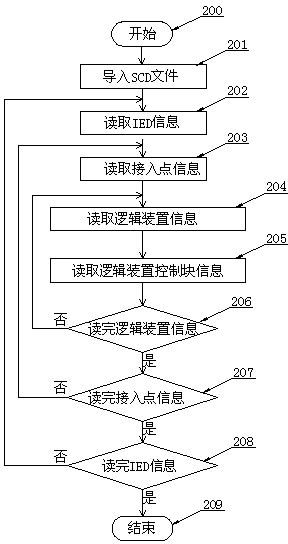
[0064] Such as figure 2 As shown, the collection process of virtual terminal data informati...


PUM


Abstract

Provided is a virtual terminal graphical display method of field debugging of an intelligent transformer substation. The virtual terminal graphical display method of field debugging of the intelligent transformer substation comprises the following steps of collecting data information of a virtual terminal, a cable, an optical cable and a terminal wiring diagram, checking the collected data information, outputting a check result, correcting the wrong data information, storing the collected data information in a database, generating a cable label, and carrying out graphical displaying on the virtual terminal. The virtual terminal graphical display method of field debugging of the intelligent transformer substation effectively solves the problems that the data informatization rate is low and the automation rate is low in the field debugging process of the intelligent transformer substation in the prior art, avoids repeated labor, saves manpower and material resources and relieves burdens of debugging personnel. The virtual terminal graphical display method of field debugging of the intelligent transformer substation improves the field debugging efficiency and working efficiency by improving the electronization and utilization rate of field debugging data.

Description

technical field [0001] The invention relates to the technical field of power systems, in particular to a graphical display method for on-site debugging virtual terminals of intelligent substations. Background technique [0002] With economic development, social progress, continuous improvement of technology and information technology, and global resource and environmental issues becoming increasingly prominent, the development of power grids is facing new issues and challenges. Relying on modern information, communication and control technologies, actively developing smart grids and meeting the requirements of sustainable development in the future has become a realistic choice for international power development. As an important support for smart grid construction, intelligent substations with networked control, digital measurement, online testing and status monitoring have laid a material foundation for the safe and stable operation of the power system and provided sufficie...

Claims


Application Information

Patent Timeline
IPC IPC(8): H02B15/02
Inventor 刘德华迟玉龙吕念程婷婷孙风云王恺
Owner SHANDONG ELECTRIC POWER TRANSMISSION & SUBSTATION ENG CO
Learn More