Multi-dimensional graphic display method based on virtual connection between SCD devices in smart substation

A smart substation and graphic display technology, applied in the direction of instruments, data processing applications, information technology support systems, etc., can solve the problems of not showing the correlation degree of input virtual terminals, trouble, not showing two-way interaction, etc.

Active Publication Date: 2017-09-26
STATE GRID SICHUAN ELECTRIC POWER CORP ELECTRIC POWER RES INST +2
View PDF5 Cites 0 Cited by
  • Summary
  • Abstract
  • Description
  • Claims
  • Application Information

AI Technical Summary

Problems solved by technology

This manual checking method is time-consuming and laborious. You can only check the relevant information for one virtual connection at a time, which is very troublesome.
Some manufacturer's SCD tool can view all virtual connections of a certain device at the same time, but this method does not display the sending source information of the input virtual terminal (such as which sending control block of the sending IED sent by the sending LD), and does not display Which receiving LD of the receiving IED will receive it, and there is no graphical display of the macroscopic relationship between virtual connections between IEDs
The above two methods lead to very low work efficiency in the debugging and maintenance phase
[0004] Although domestic patents have studied the graphic display of SCD, such as the patent "Smart Substation SCD Configuration File Graphical Display Method" discusses the data interaction relationship between two IEDs and their virtual terminal connections, but only draws the network topology structure, but the relationship between the input virtual terminals between the two IEDs is not clearly described, and it is not stated whether they come from the same transmission source
The patent "Intelligent Substation SCL Configuration File Management and Graphical Display System" mentioned a hierarchical graphical display module for configuration files, but it is not clear how to express and display the virtual connection between IEDs
The patent "coordinated design method of secondary virtual circuit graph based on standardized virtual terminals" establishes a virtual terminal diagram among various devices in the whole station, but the diagram is too large. When a certain device has a large number of input virtual terminals (dozens of or hundreds of), it is inconvenient to view in one picture
[0005] There are some common deficiencies in the existing related SCD graphical viewing methods, none of which shows the transmission source information of the IED where the input virtual terminal of a certain device is located; when there are many input virtual terminals, the correlation between each input virtual terminal is not displayed Degree (whether it comes from the same or different sending control blocks of the same sending device); it does not show that a certain sending IED may send to two receiving LDs (two different functional modules) of the receiving IED, and a sending IED An LD may not send virtual terminals to the receiving IED, but may receive virtual terminals sent from the receiving IED; there is no display and reflection of the two-way interaction between the receiving IED and the sending IED sending virtual terminals

Method used


Image

  • Multi-dimensional graphic display method based on virtual connection between SCD devices in smart substation
  • Multi-dimensional graphic display method based on virtual connection between SCD devices in smart substation
  • Multi-dimensional graphic display method based on virtual connection between SCD devices in smart substation

Examples


Embodiment Construction

[0065] A multi-dimensional graphical display method based on the virtual connection between the devices of the smart substation SCD comprises the following steps:

[0066] 1. Obtain the SCD configuration file from the smart substation.

[0067] 2. Use the Document Object Model DOM (Document Object Model, a programming interface for HTML and XML documents) to read each IED node in the SCD file, construct a List linked list of all IEDs, and then put each IED node in the IED linked list The IED name is written into the IED tree control on the interface.

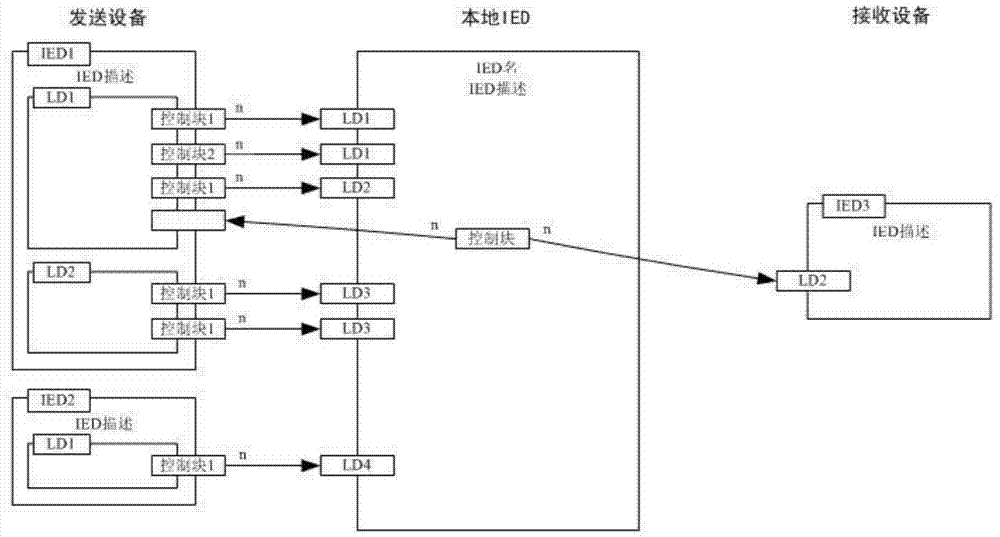
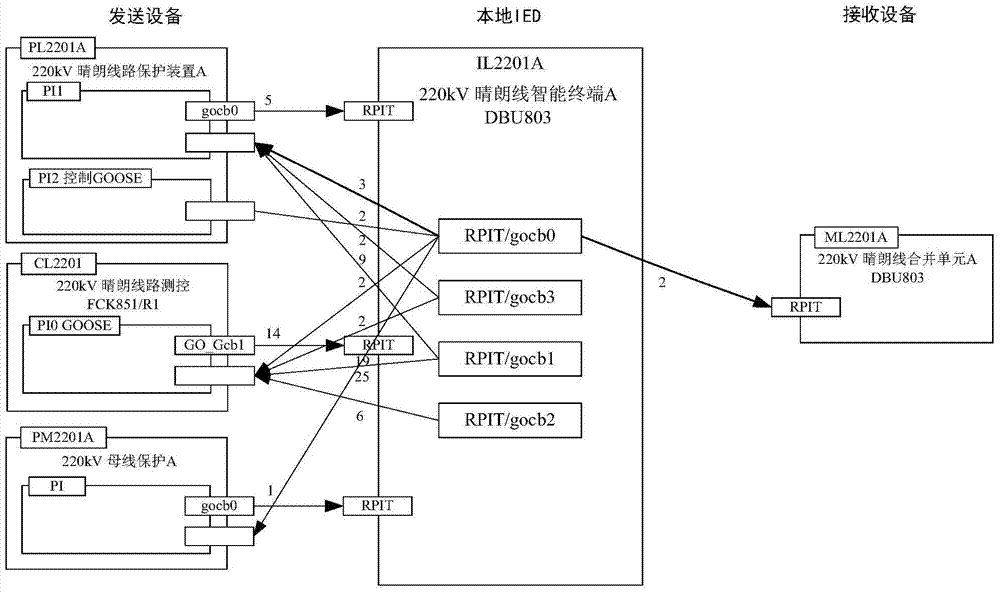
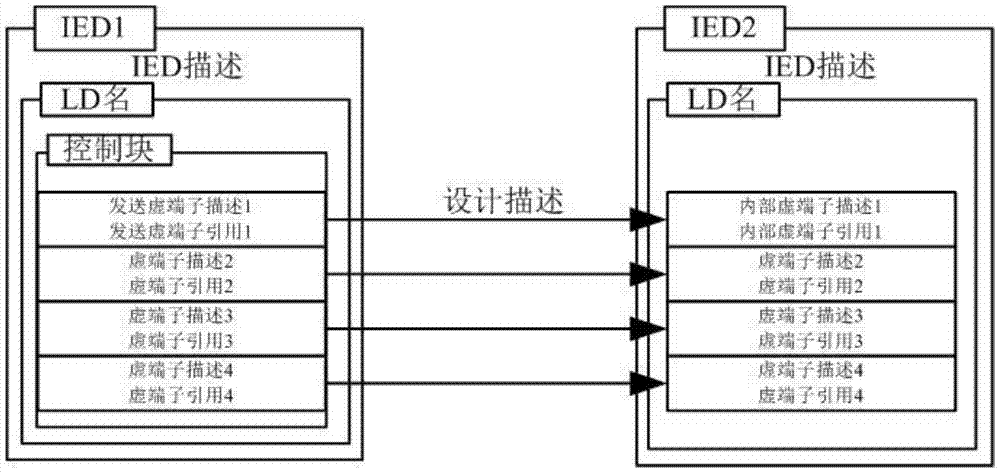
[0068] 3. Propose the concept of "macro connection", construct corresponding virtual connection, sending device, receiving device, sending control block, input macro connection, output macro connection and other structures for each IED, and form a corresponding List list:

[0069] (1) Process each IED, treat it as the current local IED, analyze the sub-node Inputs of the LN0 node under each LD under the IED layer by layer, and ...


PUM


Abstract

The invention provides a multi-dimensional graphical display method based on virtual connection between all devices of a smart substation SCD. The multi-dimensional graphical display method abides by the human thinking habit of being from the macro view to the micro view. The multi-dimensional graphical display method comprises the steps that virtual connection between all IEDs in the SCD are read; a corresponding input virtual terminal description, an internal virtual terminal description, a sending source and other types of information are searched for; a concept of macro connection is put forward to express a set of related virtual connection, coming from the same sending source (same source) and sent to the same receiving logic LD (same receiver), between every two devices; a data chain table of the macro connection, the sending end device and the receiving end device of each receiving IED is constructed; a macro main graph and four subgraphs are constructed and drawn by means of the graphical display technology. According to the multi-dimensional graphical display method, a user can quickly, visually and accurately acquire and check information of all virtual terminals of each device, the problems that traditional manual search is complex, low in efficiency, prone to errors and omission and the like are solved, and working efficiency and accuracy of debugging and maintenance of a smart substation are greatly improved.

Description

technical field [0001] The invention belongs to the technical field of commissioning, operation, maintenance, and equipment research and development of intelligent substations, and specifically relates to a multi-dimensional graphical display method based on virtual connections between SCD devices of intelligent substations. Background technique [0002] In the smart substation, the substation configuration description SCD (Substation Configuration Description) is responsible for describing the configuration information of the smart substation automation system, giving the communication parameters of the whole station, and the configuration parameters of each intelligent electronic device IED (Intelligent Electronic Device). The traditional terminal-to-terminal cable connection between various devices has become a device that sends network signals GOOSE (Generic Object Oriented Substation Events, SV (Sampled Value) to other devices through the network in the smart substation,...

Claims


Application Information

Patent Timeline
Patent Type & Authority Patents(China)
IPC IPC(8): G06Q50/06
CPCY04S10/50
Inventor 刘明忠尹笋蔡刚林苏少春童晓阳郑永康李松涛罗琛庄先涛田力智鲁慧琳杨浩黄霞崔弘
Owner STATE GRID SICHUAN ELECTRIC POWER CORP ELECTRIC POWER RES INST
Why Eureka
Try Eureka