Complex system supervision graph embedding structural data visualized monitoring method based on relevant measurement

A correlation measurement, structured data technology, applied in structured data retrieval, database indexing, electronic digital data processing, etc.

Inactive Publication Date: 2014-09-24
HARBIN INST OF TECH
View PDF1 Cites 7 Cited by
  • Summary
  • Abstract
  • Description
  • Claims
  • Application Information

AI Technical Summary

Problems solved by technology

[0004] The present invention aims to solve the existing problem that it is difficult to realize visual monitoring of complex system supervision graph embedded in structured data, thereby providing a visual monitoring method based on correlation measurement (Supervised Graph Embedding based on Correlation, SGEC )

Method used


Image

  • Complex system supervision graph embedding structural data visualized monitoring method based on relevant measurement
  • Complex system supervision graph embedding structural data visualized monitoring method based on relevant measurement
  • Complex system supervision graph embedding structural data visualized monitoring method based on relevant measurement

Examples


specific Embodiment approach 1

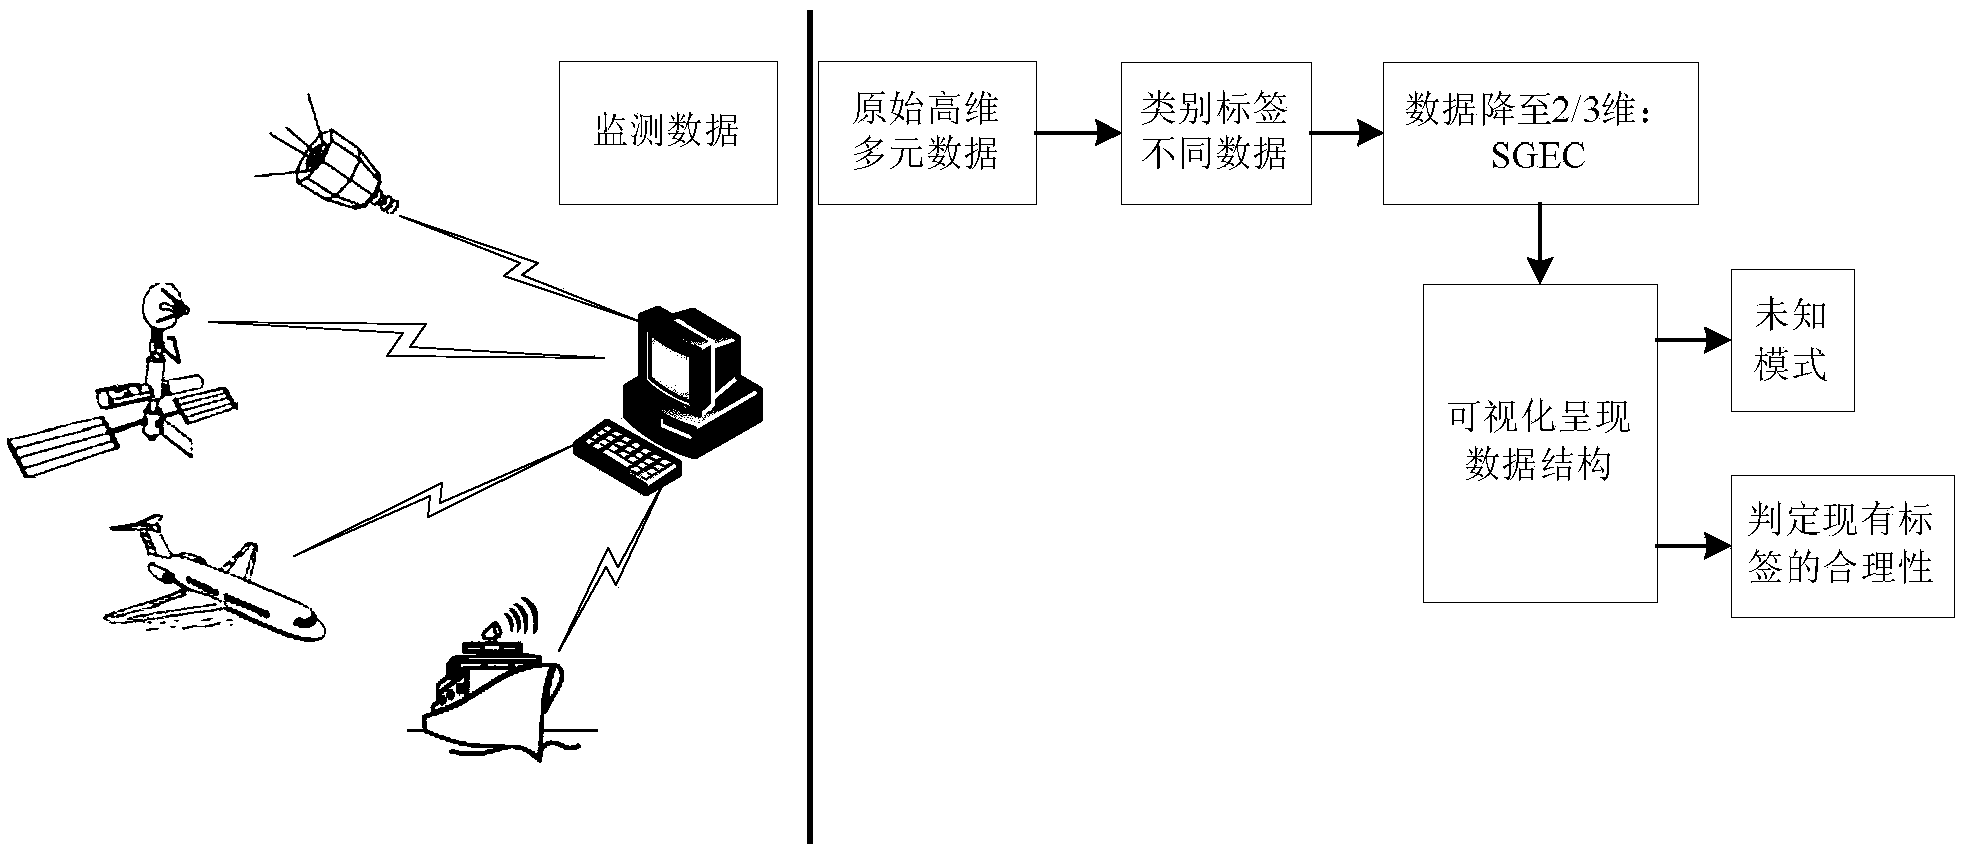
[0038] Specific implementation mode 1. Combination figure 1 Describe this specific implementation mode, the complex system supervision diagram based on the correlation measurement is embedded in the structured data visualization monitoring method, and the complex system data X is collected, and the complex system data X is m type n-dimensional data {x 1 ,x 2 ,...,x m},x i ∈ R n ,i=1,2,...m, solve the linear mapping matrix A, A=(a 0 ,a 1 ,...,a l-1 ), map this n-dimensional data to l-dimensional space {y 1 ,y 2 ,...y m},y i ∈ R l ,i=1,2,...m(li =A T x i ,y i stands for x i Mappings in low-dimensional spaces.

[0039] Use the label information and correlation of the data to compose the graph. Similar data can be connected, and the edges connecting data nodes are obtained by measuring the correlation between data. It is guaranteed that points of the same class in the original space are still of the same class in the low-dimensional mapped space.

[0040] The Sup...


PUM


Abstract

The invention provides a complex system supervision graph embedding structural data visualized monitoring method based on relevant measurement and relates to a complex system supervision graph embedding structural data monitoring method to solve the problem that visualized monitoring on complex system supervision graph embedding structural data is difficult to achieve at present. The complex system supervision graph embedding structural data visualized monitoring method based on relevant measurement comprises the steps that dimension reduction is conducted on complex system high dimensional data, and space structural relations among data points are saved; the high dimensional data are reduced into two-dimensional or three-dimensional data which can be seen by human eyes, the structural relations among the data points are observed in a visible space, and the visualization presentation of high dimensional data is achieved. The complex system supervision graph embedding structural data visualized monitoring method based on relevant measurement is suitable for complex system supervision graph embedding structural data visualized monitoring occasions.

Description

technical field [0001] The invention relates to a monitoring method for embedding structured data in a complex system monitoring graph. Background technique [0002] At present, the application of graph-embedded data analysis method for visual analysis of data is rare, and the visual analysis of complex system operation monitoring data or experimental test data has not been reported. [0003] The existing graph embedding data analysis methods mainly include Locality Linear Embedding (LLE), Laplacian Eigenmaps (Laplacian Eigenmaps, LE) and Locality Preserving Projection (LPP) algorithms. LLE has difficulty in selecting parameters of neighboring points; LE algorithm is a nonlinear algorithm, which is unfavorable for maintaining the structure between data points; LPP algorithm is an unsupervised method, and there are problems such as difficulty in parameter selection when building a neighboring graph. Contents of the invention [0004] The present invention aims to solve the...

Claims


Application Information

Patent Timeline
Patent Type & Authority Applications(China)
IPC IPC(8): G06F17/30
CPCG06F16/22
Inventor 李君宝刘大同印姗梁军彭宇彭喜元
Owner HARBIN INST OF TECH
Why Eureka
Try Eureka