[0049] Embodiment one:
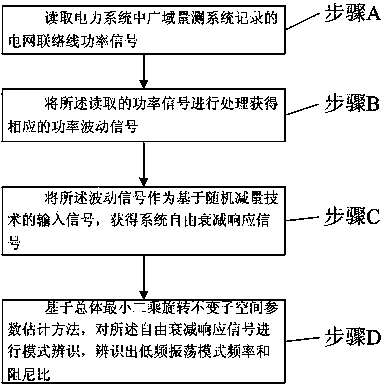
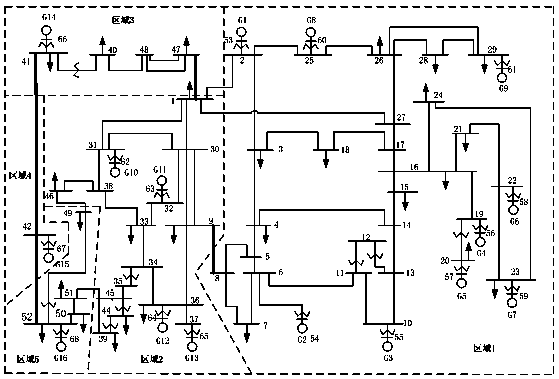
[0050] In Embodiment 1, a method for identifying parameters of a power system low-frequency oscillation mode is provided. Please refer to Figure 1-Figure 2 , the method includes:
[0051] Step A: Read the grid tie line power signal recorded by the wide area measurement system in the power system;
[0052] Step B: Process the read power signal to obtain a corresponding power fluctuation signal;
[0053] Step C: using the fluctuating signal as an input signal based on a random decrement technique to obtain a system free attenuation response signal;
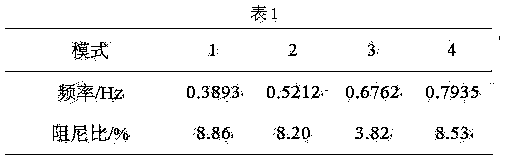
[0054] Step D: Based on the overall least squares rotation invariant subspace parameter estimation method, perform mode identification on the free decay response signal, and identify the low frequency oscillation mode frequency and damping ratio.
[0055] Wherein, in the embodiment of the present application, the processing of the read power signal to obtain the corresponding power fluctuation signal is specifically:
[0056] The read power signal is preprocessed to remove abnormal data, when the data is missing, the previous normal data is used to fill the missing data, and the DC component is removed by subtracting the data mean value to obtain a power fluctuation signal with a data length of N Δ P ac , the sampling interval is T s.
[0057] Wherein, in the embodiment of the present application, the step C: the Δ P ac As an input signal based on the random decrement technique, the obtained length is L The system free decay response signal of y ( i )( i =1,2,... L ) specifically include:
[0058] C1: Calculate Δ according to formula 1 P ac standard deviation Δ P std;
[0059] (1)
[0060] where: Δ ac is Δ P ac the mean value of N is the number of measured data; in order to ensure the accuracy of the random decrement technique in estimating the free attenuation response of the system, the number of data N Take the number of theoretical sampling data of the system within 10 minutes, namely:
[0061] (9)
[0062] C2: Determine the extreme value trigger condition according to formula 2 T k parameter, cut T k The length after time is L The stationary zero-mean time series signal of k The subsample function is Z k ( i )( i =1,2,... L , k =1,2,... K );
[0063] (2)
[0064] C3: According to formula 3, the system free attenuation response signal contained in the stationary zero-mean time series signal is calculated based on the sub-sample function y ( i )( i =1,2,... L );
[0065] (3)
[0066] in, L Take the theoretical sampling number of the system within 10 seconds, namely:
[0067] (10)
[0068] Wherein, in the embodiment of the present application, the step D: based on the overall least squares rotation-invariant subspace parameter estimation method, conducts mode identification on the free decay response signal, and identifies the low-frequency oscillation mode frequency and damping ratio specifically including :
[0069] D1: Use the free attenuation signal y Sample data in y (1), y (2),……, y ( L ) to construct the Hankel data matrix X :
[0070] (4)
[0071] in, L is the number of free decay response data, M =[ L /2];
[0072] D2: pair matrix X Do a singular value decomposition:
[0073] (5)
[0074] in, Represents singular value decomposition; H Represents the conjugate transpose; U for the matrix X The left singular value vector of ; V for the matrix X The right singular value vector of ; ∑ is a diagonal matrix, and the diagonal elements are matrices X singular value of , ,...,;max( L - M +1, M ) means take ( L - M +1), M the larger number in
[0075] D3: Determine the order of the signal subspace p :
[0076] compares the elements in the diagonal matrix Σ , to find the satisfying The smallest integer of i , take the order of the signal subspace p = i , so that the right singular value vector matrix ,in V s for the front p The order right singular value vector signal subspace, V n is the right singular value vector noise subspace;
[0077] D4: order , , the symbols ↑ and ↓ respectively represent the first row and the last row of the matrix deletion matrix, and the construction matrix [ V 1 , V 2 ], and perform singular value decomposition:
[0078] (6)
[0079] in, for the matrix [ V 1 , V 2 ]’s left singular value vector; for the matrix [ V 1 , V 2 ]'s right singular value vector; is a diagonal matrix, and the diagonal elements are matrix [ V 1 , V 2 ] singular value;
[0080] D5: will be divided into 4 The block matrix of :
[0081] (7)
[0082] D6: Calculate - The eigenvalues of , subscript j is the eigenvalue serial number;
[0083] D7: Calculate the power fluctuation signal sequence Δ P ac The frequency of each oscillation mode in , Attenuation coefficient and damping ratio :
[0084] (8)
[0085] in: is the sampling time interval, arg is the The angle of , ln means to take the natural logarithm, and Re means to take the real part of the complex number.
[0086] Among them, in practical applications, random decrement technique (RDT) has been widely used in many aspects such as structural parameter identification and fault diagnosis due to its advantages of simple implementation and real-time data processing. The core of the technology is to assume a system subjected to a stationary random excitation, and its response is the superposition of the deterministic response determined by the initial conditions and the random response excited by external loads. Under the same initial conditions, the time history of the response is intercepted in multiple segments, and the overall average is calculated for the intercepted multi-segment signals, so as to achieve the purpose of extracting the free decay response.
[0087] The scheme in the embodiment of the present application is introduced through the simulation experiment below:
[0088] The scheme in the embodiment of this application is simulated and verified by using the IEEE16 machine 68 node test system, such as figure 2 The system shown is mainly divided into 5 areas, area 1 (G1~G9), area 2 (G10~G13), area 3 (G14), area 4 (G15), area 5 (G16). Through the analysis of the eigenvalues of the state matrix after system linearization, it can be seen that there are four dominant oscillation modes in the system, as shown in Table 1. Table 1 shows the theoretical value of the inter-area low-frequency oscillation mode of the 16-machine 68-node system. Mode 1 is regions 1-2 oscillating relative to regions 3-5, mode 2 is regions 1-4 oscillating relative to region 5, mode 3 is region 1 oscillating relative to region 2, and mode 4 is region 3 and region 5 oscillating relative to 4 Oscillations. Select mode 1 and mode 3 for active power monitoring of inter-area tie lines 1-47 and 8-9 respectively, and select mode 2 and mode 4 for active power monitoring of inter-area tie lines 41-42.
[0089] In order to simulate the small random disturbance in the actual power system, a random small disturbance power signal with an amplitude of 0.5% of the load point is injected into the main load node of the 16-machine 68-node system. The power disturbance signal obeys the Gaussian distribution, and the simulation time is 10 minutes. Using Monte Carlo simulation, 100 simulation experiments were carried out, and the method in this application was tested from the perspective of probability and statistics. Table 2 shows the identification results of the method in this application under the condition of no noise.
[0090]
[0091]
[0092] From this, it can be seen that comparing the above identification results with the eigenvalue settlement results after system linearization, it can be seen that the random response signal is processed by the method in this application, and the frequency and damping ratio average values obtained by multiple experiments are close to the theoretical values. The relative errors of the mean values of the frequencies and damping ratios of each mode are less than 10%, and the standard deviations of the frequencies and damping ratios are small, indicating that the method in this application can more accurately identify the low-frequency oscillation mode parameters from the random response signals of the power system.
[0093] In order to verify the noise immunity of the method in this application, take the weak damping mode 3 that is the most concerned and has the greatest impact on the system as the research object, and add different decibels of noise to the power signal of the tie line between bus 8 and bus 9, using this The method of the invention is used to identify the parameters of the low-frequency oscillation mode. Table 3 shows the identification results of the method in this application under different noise levels.
[0094]
[0095] It can be seen from Table 3 that by combining the stochastic decrement technique with the TLS-ESPRI method, under different noise levels, the identification results of low-frequency oscillation mode parameters of power systems based on random response signals are very close to the theoretical values, and the standard deviations of frequency and damping ratio The change is small, indicating that the method in this application has strong noise immunity.
[0096] The above-mentioned technical solutions in the embodiments of the present application have at least the following technical effects or advantages:
[0097] Since the grid tie line power signal recorded by the wide-area measurement system in the power system is firstly read; then the read power signal is processed to obtain the corresponding power fluctuation signal; The input signal of the quantitative technique is used to obtain the free attenuation response signal of the system; finally, based on the total least squares rotation invariant subspace parameter estimation method, the mode identification of the free attenuation response signal is carried out to identify the low frequency oscillation mode frequency and damping ratio technology The scheme, that is, directly use the random response signal of the system excited by the load fluctuation under the normal operation of the power grid, does not rely on the free attenuation response of the large disturbance excitation system, and the fluctuation of the environmental noise signal is not obvious compared with the transient oscillation signal. The signal is greatly affected by noise, and the total least squares-rotation invariant technology is used to identify the mode parameters, and the low-frequency oscillation mode can be well identified under the conditions of low noise level and high noise level, which is helpful to accurately grasp the normal state of the power grid The dynamic characteristics of the system in the running state lay the foundation for suppressing the occurrence of weakly damped or negatively damped low-frequency oscillations and improving the stability of the power grid. The frequency and damping of the low-frequency oscillation mode of the system are identified by using the environmental noise data induced by load fluctuations in the normal operation of the system Therefore, it effectively solves the technical problems of weak noise immunity and poor identification accuracy in the existing random response signal-based power system low-frequency oscillation mode parameter identification method, and then realizes The parameter identification method of low-frequency oscillation mode of power system based on random response signal has strong noise immunity and high identification accuracy.