
GIS (geographic information system)-platform based dynamic charting method for real-time weather of power-grid foul areas

A power grid polluted area and real-time meteorological technology, applied in ICT adaptation, climate sustainability, electrical digital data processing, etc.

Inactive Publication Date: 2015-01-14
SHANDONG LUNENG SOFTWARE TECH
View PDF4 Cites 1 Cited by
  • Summary
  • Abstract
  • Description
  • Claims
  • Application Information

AI Technical Summary

Problems solved by technology

[0005] At present, there is no way to make the drawing of the polluted area of ​​the power grid on the GIS platform more realistic and vivid. Users can analyze the pollution level of the power grid through the real-time display of the polluted area of ​​the power grid on the front end of the GIS platform

Method used


Image

  • GIS (geographic information system)-platform based dynamic charting method for real-time weather of power-grid foul areas
  • GIS (geographic information system)-platform based dynamic charting method for real-time weather of power-grid foul areas

Examples


Embodiment Construction

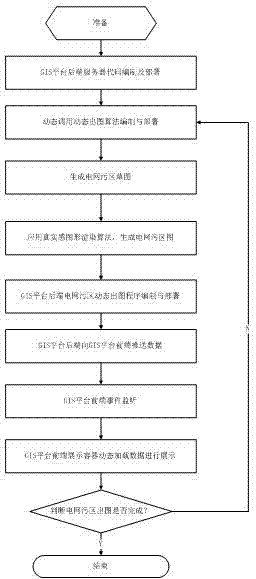
[0025] Accompanying drawing is a kind of specific embodiment of the present invention. A kind of real-time meteorological dynamic drawing method of grid polluted area based on GIS platform of this embodiment comprises the following steps:

[0026] (1), compile and deploy the back-end service code of the GIS platform, and receive meteorological data in real time;

[0027] (2) Different services at the back end of the GIS platform dynamically invoke the compilation and deployment of dynamic mapping algorithms, and dynamically invoke layer data according to the logic processing of the received data;

[0028] (3) Compilation and deployment of the dynamic drawing program of the power grid pollution area at the back end of the GIS platform. First, create a png format image, call the image generation algorithm to load the grid resource data of the relevant layer, and draw thematic maps of each rule base category according to the acquired data. Then, according to the GIS modeling tec...


PUM


Abstract

The invention belongs to the technical field of cartography and geographic information engineering, and particularly relates a GIS (geographic information system)-platform based dynamic charting method for real-time weather of power-grid foul areas. The GIS-platform based dynamic charting method includes the following steps: writing and deploying GIS platform rear-end service codes, writing and deploying dynamic calling and dynamic charting algorithms for different services of a GIS platform rear-end, writing and deploying dynamic charting programs of the power-grid foul areas of the GIS platform rear-end, rendering power-grid foul area maps to generate final power-grid foul area maps, pushing data to a GIS platform front-end by the GIS platform rear-end, monitoring GIS platform front-end events, and dynamically loading data for display by a display container of the GIS platform front-end. By the method, foul areas and pollution source points of power-grid resource regions can be automatically charted, and thematic maps such as pollution point influence coverage maps can be conveniently and truly generated.

Description

(1) Technical field [0001] The invention belongs to the technical field of cartography and geographic information engineering, and in particular relates to a method for generating real-time meteorological dynamic maps of power grid polluted areas based on a GIS platform. (2) Background technology [0002] The dynamic power grid pollution area distribution map is a living map, and the traditional power system pollution area distribution map is a static map. Using the dynamic power grid pollution area distribution map can detect the pollution level changes of power transmission and transformation equipment in real time compared with the traditional power grid pollution area distribution map . [0003] The information of the distribution map of the dynamic grid pollution area is dynamic, electronic, and vectorized, and the information is easy to transmit and share. The dynamic power grid pollution area distribution map combined with the GIS platform information service sys...

Claims


Application Information

Patent Timeline
Patent Type & Authority Applications(China)
IPC IPC(8): G06F17/30G06F9/44
CPCG06F16/29Y02A90/10
Inventor 田兵常英贤曲小白王玉家焦洋孙术伟
Owner SHANDONG LUNENG SOFTWARE TECH
Learn More