
Seismic data mapping method and system

A seismic data and data technology, which is applied in the field of oil and gas geophysical exploration and development, can solve problems affecting data processing quality, graphic distortion, and failure to normally identify waveform trends, etc.

Inactive Publication Date: 2015-01-21
CHINA PETROLEUM & CHEM CORP +1
View PDF3 Cites 3 Cited by
  • Summary
  • Abstract
  • Description
  • Claims
  • Application Information

AI Technical Summary

Problems solved by technology

[0004] In the process of realizing the present invention, the inventor of the present invention found that the prior art has at least the following technical defects: due to the incomplete understanding of the seismic data format by the developers, in the process of seismic data display, the graphics drawn are often distorted (such as , burr phenomenon), which cannot reflect the true form of seismic data normally, resulting in the subsequent data processing personnel being unable to identify the waveform trend normally and affecting the quality of data processing

Method used


Image

  • Seismic data mapping method and system
  • Seismic data mapping method and system
  • Seismic data mapping method and system

Examples


no. 1 example

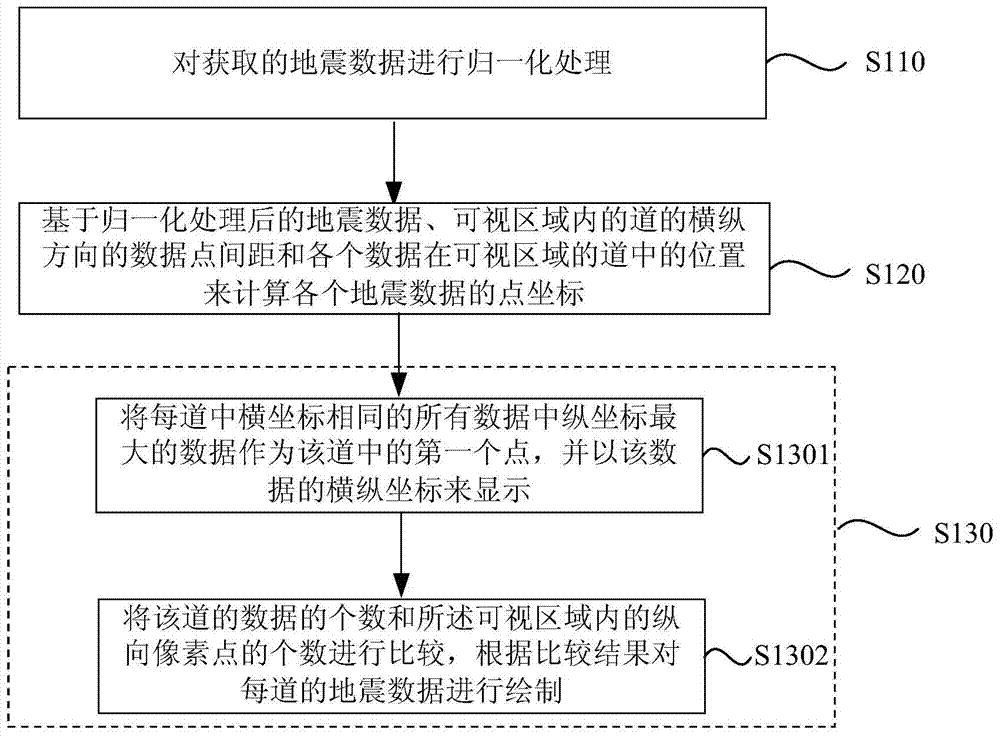
[0034] figure 1 It is a schematic flowchart of a seismic data mapping method according to an embodiment of the present invention. Refer below figure 1 Each step of this embodiment will be described in detail.

[0035] Step S110 (hereinafter the word "step" is omitted) performs normalization processing on the acquired seismic data.

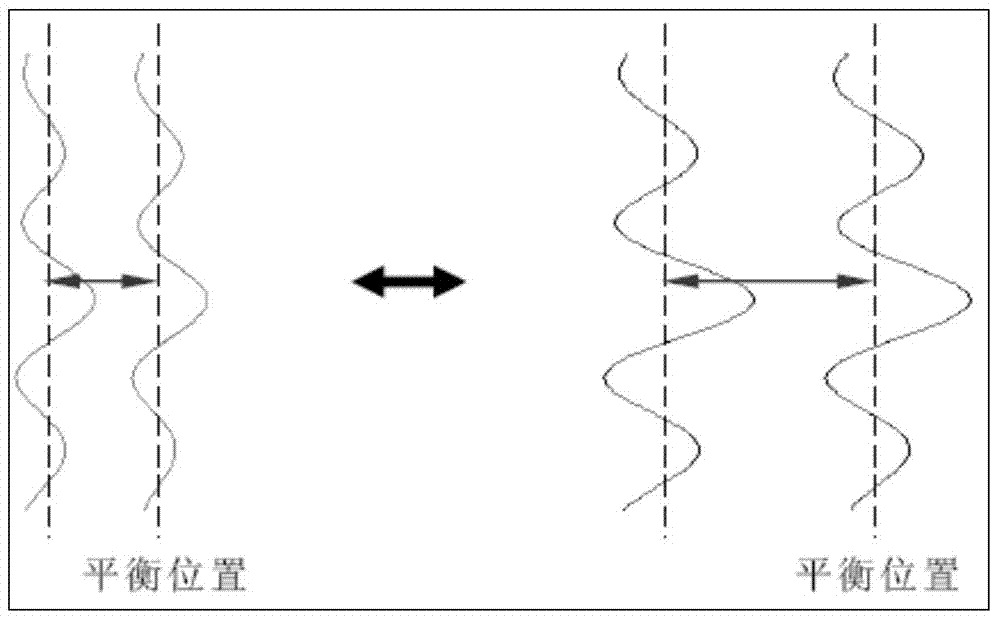
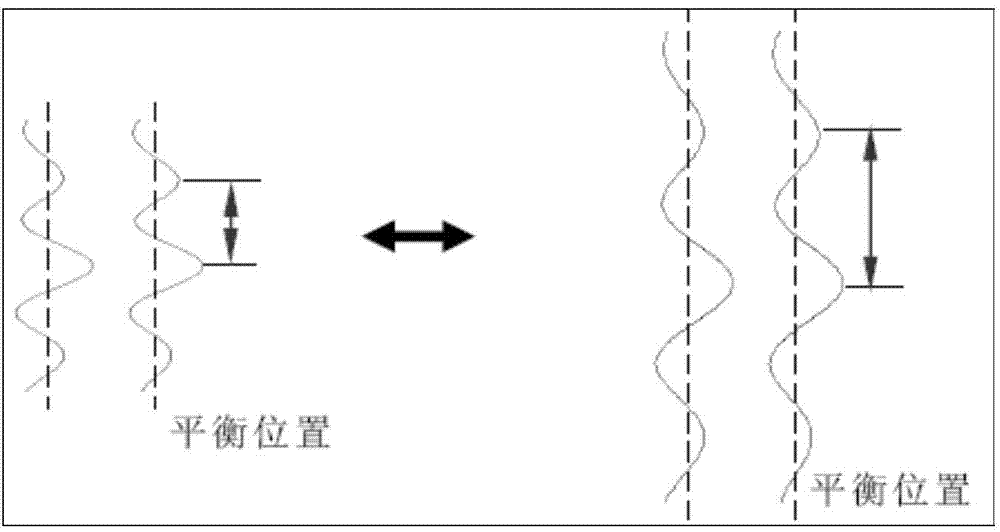
[0036] It should be noted that the magnitude of the seismic data value represents the strength of the amplitude, and the positive or negative represents the direction of the vibration. They well record the vibration of the receiver point at the equilibrium position. Moreover, these characteristics do not change with the transformation of the graph, so the waveform is similar before and after the transformation.

[0037] Using the above similarity, the waveform can be converted to a certain range, and the characteristics of the entire waveform can be maintained. All subsequent transformation operations can be regarded as multiplying a coefficient...

no. 2 example

[0079] Figure 7 is a schematic structural diagram of a seismic data imaging system according to a second embodiment of the present invention. Refer below Figure 7 To illustrate the structure and function of the system.

[0080] Such as Figure 7 As shown, the system mainly includes a normalization module 71 , a point coordinate calculation module 73 and an interpolation drawing module 75 and other structures.

[0081] A normalization module 71, which performs normalization processing on the acquired seismic data. Preferably, in one embodiment, the seismic data is transformed into the range [-1, 1], so that not only the relative magnitude of the data values ​​is preserved, but also the sign of the data indicating the direction of vibration is preserved.

[0082] Specifically, the normalization module 71 includes an acquisition unit 711 , a comparison unit 712 and a normalization unit 713 .

[0083] An acquisition unit 711, which acquires the maximum and minimum values ​​...


PUM


Abstract

The invention discloses a seismic data mapping method and system. The method comprises the following steps: a normalization step; to be specific, carrying out normalization processing on obtained seismic data; a point coordinate calculation step; to be specific, calculating point coordinates of all seismic data based on the seismic data after normalization processing, data point intervals at horizontal and longitudinal directions of channels in a visual region, and positions of all data in the channels of the visual region; and an interpolation drawing step; to be specific, carrying out linear interpolation processing according to the point coordinates, obtained by calculation, of all seismic data, thereby completing seismic data drawing. According to the invention, graph distortion and deformation during traditional seismic data region filling drawing can be prevented; the burr phenomenon is eliminated; and objectives of seismic data mapping effect optimization and data processing quality improvement can be achieved.

Description

technical field [0001] The invention relates to the field of oil and gas geophysical exploration and development, in particular to a seismic data mapping method and system. Background technique [0002] The display of seismic data is a very important process in the oil and gas seismic exploration industry, and the quality of data display (resolution) directly affects the quality and efficiency of data processing. [0003] At present, with the continuous increase of the amount of seismic exploration data, the amount of data used has formed a huge data body, and the algorithms for generating images are relatively complex. Through these algorithms for generating images, the visualization effect of seismic sections can be intuitively and accurately reproduced. [0004] In the process of realizing the present invention, the inventor of the present invention found that the prior art has at least the following technical defects: due to the incomplete understanding of the seismic da...

Claims


Application Information

Patent Timeline
IPC IPC(8): G01V1/34
Inventor 祝媛媛居兴国陈楠
Owner CHINA PETROLEUM & CHEM CORP
Learn More