
Detection method for building abnormal energy consumption data

A data detection and anomaly technology, applied in data processing applications, electrical digital data processing, special data processing applications, etc., can solve problems such as inaccuracy, failure of the system to capture, and complex fluctuations in energy consumption data to overcome defects Effect

Active Publication Date: 2015-05-20
江苏联宏智慧能源股份有限公司
View PDF2 Cites 23 Cited by
  • Summary
  • Abstract
  • Description
  • Claims
  • Application Information

AI Technical Summary

Problems solved by technology

In actual operation, energy consumption is affected by conditions such as climate, personnel, and seasons, and the fluctuation of energy consumption data is more complicated. It is obviously inaccurate to judge abnormalities by setting a single static data
Through tracking the operation of multiple systems, it is found that the system cannot catch when anomalies occur, and misjudgments and false alarms occur from time to time, which not only fails to help users use energy accurately, but also interferes with users' work in some cases

Method used


Image

  • Detection method for building abnormal energy consumption data
  • Detection method for building abnormal energy consumption data
  • Detection method for building abnormal energy consumption data

Examples


Embodiment 1

[0028] A method for detecting abnormal building energy consumption data:

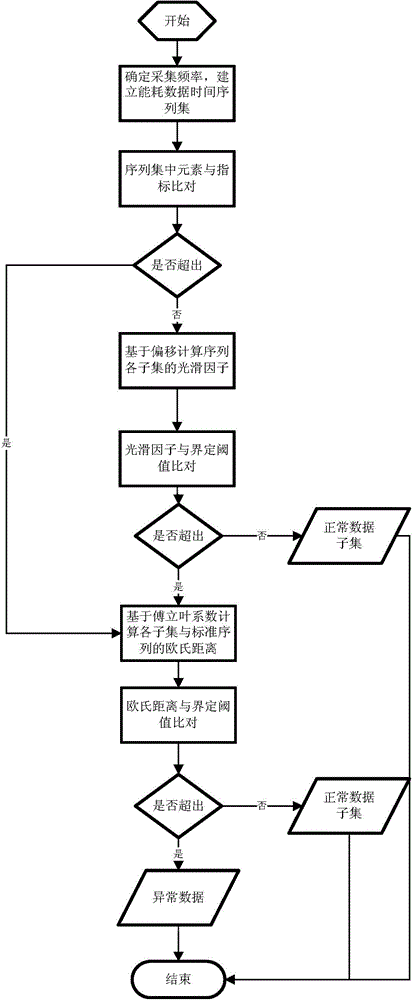
[0029] Step (1): Collect building energy consumption data with a fixed time period as the collection frequency, and establish a time series D of energy consumption data:

[0030] D = {d t |t=t 0 ,t 1 ,t 2 ,...,t n-1};

[0031] In the formula, d t is an element, representing the collected data at time t;

[0032] Step (2): Set the threshold according to the actual situation of the building and based on industry indicators, compare with the threshold, extract the abnormal elements in the time series, that is, the abnormal collection data, and use the abnormal elements as the subsequence D of D 1 ; Remove the abnormal element in the time series D as a subsequence D of D 2 :D 2 ={d 1 , d 2 ,...,d p};

[0033] Step (3): Using the deviation-based anomaly data mining method, D with a fixed length m 2 Split into s subsequences, D 2 subsequence D 2s Expressed as:

[0034] D. 2s ={d s , d s+1 ...

Embodiment 2

[0042] For example, a method for detecting abnormal building energy consumption data in Example 1, during the spring and autumn periods, the power consumption of air conditioners should be less than the power consumption of standby; during the night rest period, the power consumption and water consumption of public buildings indoor lighting should be kept at extremely low energy consumption The power consumption of office buildings during holidays should be less than that of working days; the energy consumption of commercial buildings during non-business hours should be lower than that of business hours; the fluctuation range of energy consumption values ​​of office buildings, teaching buildings and other buildings during normal use should be relatively stable.

Embodiment 3

[0044] For example, a method for detecting abnormal building energy consumption data in Embodiment 1 or 2, the dissimilarity function is defined as:

[0045] DST ( A , B ) = ( Σ i = 1 m A i ⊕ B i ) m

[0046] In the formula, A is two adjacent values ​​d q-1 , d q The difference between, B is the subsequent adjacent two numbers d q , d q+1 The difference between, m is the length of the collection object, is the exclusive-or operator, defined as A ⊕ B = 1 , ...


PUM


Abstract

The invention discloses a detection method for building abnormal energy consumption data. The detection method comprises the following steps of firstly collating original data according to a time series; then, performing judgment by referring to industry indexes so as to find out abnormal data in a specific time slot; then, filtering out an abnormal value in the abnormal energy consumption data by adopting the deviation detection technology in data mining; finally, finding out an abnormal point in the data by adopting a discrete Fourier transform-based time series. The method for performing accurate positioning on the abnormal data in building energy consumption data, provided by the invention, is capable of replacing an empirical threshold judging method generally used in current energy industry; by means of an artificial intelligent analysis method in data mining and the application of the discrete Fourier transform principle, the abnormal energy consumption data is prevented from being misjudged, misreported and omitted, and effective abnormal energy consumption monitoring information is provided for energy consumption departments and personnel.

Description

technical field [0001] The invention relates to the field of building energy consumption monitoring, in particular to a method for detecting abnormal building energy consumption data. Background technique [0002] In the building energy consumption monitoring system, abnormal energy consumption detection is an important part to ensure the safe and efficient operation of the system. With this function, operation and maintenance personnel can know the abnormal energy consumption in real time, accurately locate the fault location, and timely eliminate or repair system faults. At present, judging abnormal energy consumption data basically relies on experts or user experience, referring to industry indicators, setting a fixed limit or threshold, and triggering an alarm once the monitoring data exceeds the limit or reaches the threshold. In actual operation, the energy consumption is affected by conditions such as climate, personnel, and seasons, and the fluctuation of energy cons...

Claims


Application Information

Patent Timeline
IPC IPC(8): G06Q50/08G06F17/30
CPCG06F16/2462G06F16/2465G06Q50/08Y02D10/00
Inventor 张璐屈晨曹道柱
Owner 江苏联宏智慧能源股份有限公司
Learn More