
Power distribution network operation monitoring method based on scalable vector graphics

A vector graphics and operation monitoring technology, applied in the direction of electrical digital data processing, data processing applications, instruments, etc., can solve the problems of increasing the load of the main station, not supporting the change of the state of the power equipment, increasing the amount of network data transmission, etc., to achieve a solution The effect of shared questions

Active Publication Date: 2015-09-30
国网新疆电力有限公司巴州供电公司 +1
View PDF0 Cites 14 Cited by
  • Summary
  • Abstract
  • Description
  • Claims
  • Application Information

AI Technical Summary

Problems solved by technology

This method is simple and easy to implement, but due to the direct login to the distribution automation system, the load on the master station is increased, and the overhead of network resources is also increased, which will also have a certain impact on the operation of the distribution automation system
Moreover, if users with insufficient authority are allowed to directly log in to the distribution automation system, it will also bring certain hidden dangers to the security of the entire system
[0005] (2) Develop a browsing system separately, which is only used to browse the data and graphics in the distribution automation system, and does not support any user operations involving changing the status of power equipment
However, in the process of accessing the system, the interaction between the user and the graphics is frequent, and the CGI technology will greatly increase the data transmission volume of the network, resulting in an excessive server load, and repeated screen refreshes will also bring great inconvenience to the operation of the client
With the use of ActiveX controls, although some basic functions can be completed through the client, relevant plug-ins need to be installed on the client, and its security and cross-platform performance cannot fully meet the needs.

Method used


Image

  • Power distribution network operation monitoring method based on scalable vector graphics
  • Power distribution network operation monitoring method based on scalable vector graphics
  • Power distribution network operation monitoring method based on scalable vector graphics

Examples


Embodiment Construction

[0026] The technical content of the present invention will be further described in detail below in conjunction with the accompanying drawings and specific embodiments.

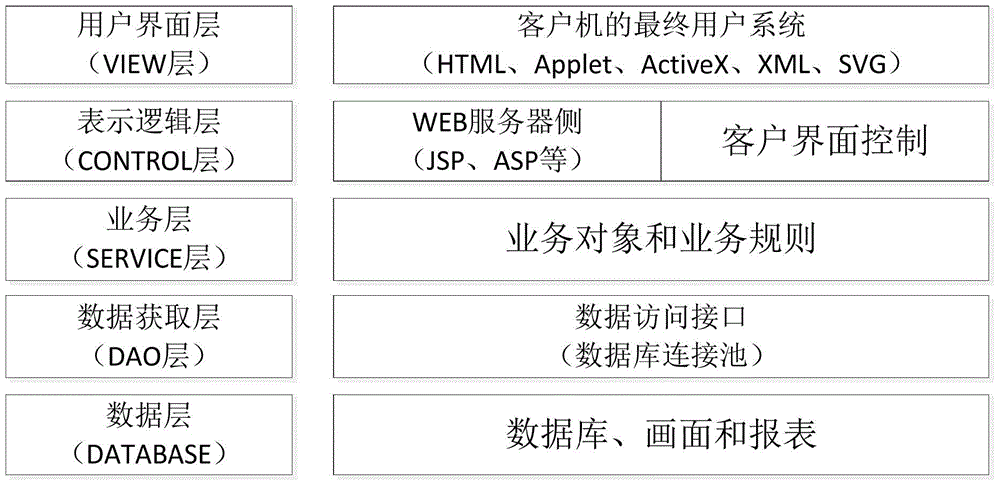
[0027] At present, the Web system used in the distribution automation system has complex functions, a large amount of data, and fast data response, and the complexity of the middle layer of the Web system is greatly increased. In order to solve this problem, the present invention divides the Web system (that is, the network information system) in the distribution automation system into multiple layers. Such as figure 1 As shown, from top to bottom are user interface layer, presentation logic layer, business layer, data access layer and data layer. The definitions of the user interface layer and the data layer at both ends are basically the same as the corresponding definitions in the three-layer structure in the prior art. The presentation logic layer in the middle includes programs for generating standardiz...


PUM


Abstract

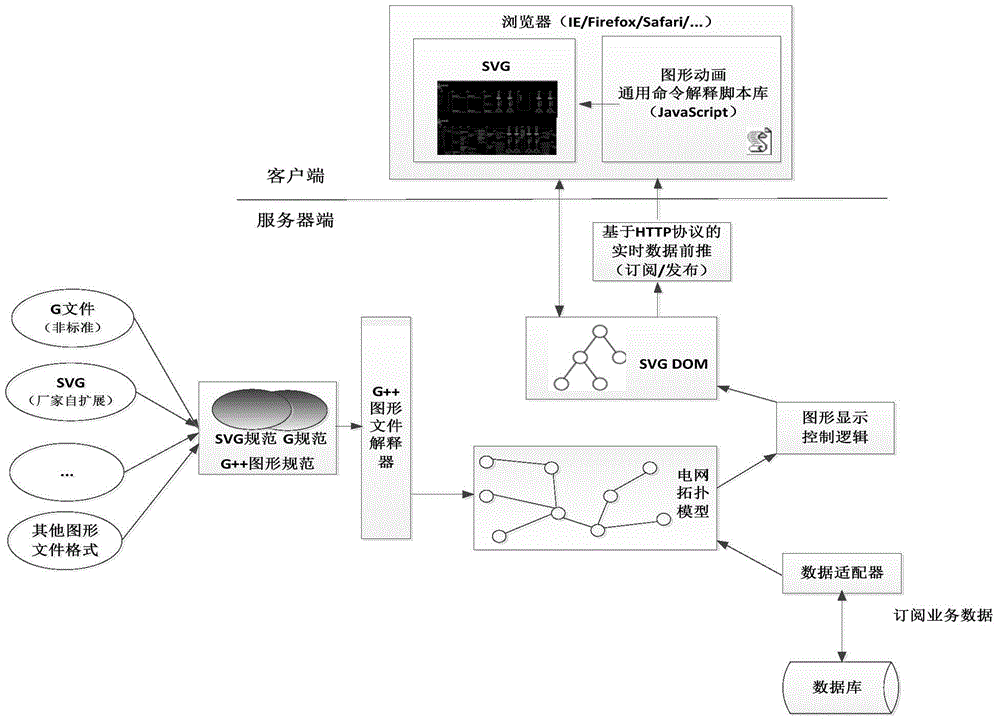
The invention discloses a power distribution network operation monitoring method based on scalable vector graphics. On a server side, a third-party file meeting a scalable vector graphic standard is inputted into a G++ graphic file interpreter, an output result of the G++ graphic file interpreter and an output result of a data adapter are jointly inputted into a power grid topology model unit, an output result of the power grid topology model unit is inputted into a graphic display control logic unit and then inputted into an SVG (scalable vector graphics) DOM (document object model); on a client side, a browser analyzes and displays the scalable vector graphics released by the SVG DOM to make it convenient for dispatching personnel to monitor operating states of a power distribution network in real time. Compared with the prior art, the power distribution network operation monitoring method based on the scalable vector graphics has the advantages that a brand new Web graphic display way and a data-to-browser push mechanism are provided, the problem of sharing of data and graphics in an automatic power distribution system is solved in a certain range, and actual requirements of power distribution network operation monitoring can be completely met.

Description

technical field [0001] The invention relates to a distribution network operation monitoring method, in particular to a distribution network operation monitoring method based on Scalable Vector Graphics (SVG), and belongs to the technical field of distribution automation. Background technique [0002] Distribution Automation System (DAS) is an automation system that enables distribution enterprises to monitor, coordinate and operate distribution equipment in a remote manner in real time, which specifically includes distribution network data acquisition and monitoring (SCADA) systems, distribution geographic Several parts such as information (GIS) system and demand side management (DSM) system. [0003] In the distribution automation system, there are a large amount of grid operation data and graphics at any time. Before using Web technology, it is very difficult for heterogeneous user terminals to browse power grid operation data and graphics. In the prior art, there are ge...

Claims


Application Information

Patent Timeline
Patent Type & Authority Applications(China)
IPC IPC(8): G06Q50/06G06F17/30
Inventor 陈光刘肖骢秦锋蕴朱如升
Owner 国网新疆电力有限公司巴州供电公司
Learn More