Fault data visualization analysis method based on numerical control system log

A technology of numerical control system and fault data, applied in general control systems, control/regulation systems, program control, etc., can solve problems such as affecting enterprise benefits, troublesome access, and inability to make good use of it, so as to get rid of capacity limitations and improve maintenance. Efficiency, the effect of optimizing the maintenance experience

Active Publication Date: 2015-12-02
HUAZHONG UNIV OF SCI & TECH +1
View PDF6 Cites 21 Cited by
  • Summary
  • Abstract
  • Description
  • Claims
  • Application Information

AI Technical Summary

Problems solved by technology

[0003] In practical applications, maintenance personnel may not be able to arrive at the scene quickly when a CNC machine tool fails, and the on-site operators cannot quickly parse the log content into a visual interface that is easy to analyze. There is still a lack of effective visual analysis methods for these fault data. This not only makes the log function of the CNC system not fully utilized, but also makes the management personnel time-consuming and laborious in the maintenance and repair of the CNC machine tools, which also reduces the maintenance efficiency of the CNC machine tools and affects the benefits of the enterprise
And today, the acquisition of fault data mainly depends on the on-site operators to manually use the U disk to access the CNC system to operate the log files on the panel, import the log files to the U disk, and then use the pre-written decoding software to convert the log files into text format. The converted text format is not neatly displayed in sections, and it is cumbersome to look up. Moreover, when the CNC system fails and cannot be turned on, the log file and fault data in the file cannot be obtained by using this method, which makes the original CNC system The functions to be realized by the log management module cannot be well utilized

Method used


Image

  • Fault data visualization analysis method based on numerical control system log
  • Fault data visualization analysis method based on numerical control system log

Examples


Embodiment Construction

[0020] In order to make the object, technical solution and advantages of the present invention clearer, the present invention will be further described in detail below in conjunction with the accompanying drawings and embodiments. It should be understood that the specific embodiments described here are only used to explain the present invention, not to limit the present invention. In addition, the technical features involved in the various embodiments of the present invention described below can be combined with each other as long as they do not constitute a conflict with each other.

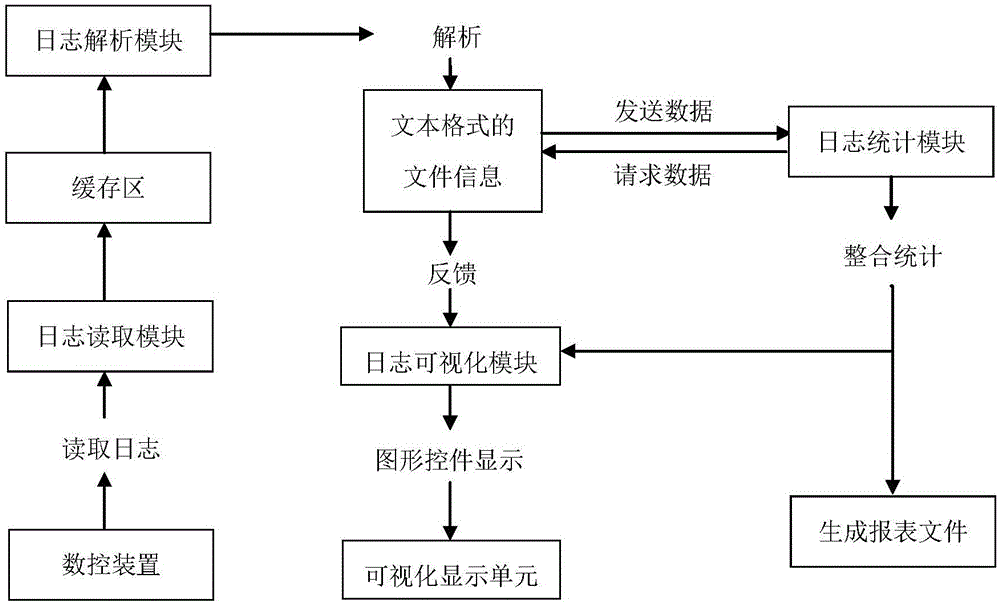
[0021] The log function of the CNC system is equivalent to the "black box" of the CNC machine tool, and the work completed by the present invention is equivalent to opening this "black box", parsing the useful information, especially the fault data information, and analyzing the binary log in the CNC system. The file is parsed and converted into a log file in text format, and then visualized to ...


PUM


Abstract

The present invention discloses a fault data visualization analysis method based on a numerical control system log. The method comprises a log reading operation of reading the logs generated in a numerical control system to a cache region for the subsequent analysis operation, a log analysis operation of analyzing the log information read in the cache region into the text format needed by the visualization, and a log visualization operation of visualizing the log information of the text format formed by the last step and reflecting the log information in a visualization display unit visually. The method of the present invention also comprises a log statistics operation step of carrying out the corresponding statistics on the visualized data and saving to realize the effective management of the logs. By utilizing the method of the present invention, the information, such as the operation status, the numerical control panel operation recording, etc., can be displayed and checked visually when a machine tool goes wrong, references are provided for the maintenance of a numerical control machine tool, and the maintenance efficiency of the numerical control machine tool is improved.

Description

technical field [0001] The invention belongs to the technical field of numerical control system information visualization, and more specifically relates to a visual analysis method for fault data based on a numerical control system log. Background technique [0002] At present, there are only a few CNC systems produced by CNC manufacturers in China that have a log function. For example, the CNC system produced by Huazhong CNC Co., Ltd. has a log management function module integrated in it. When an abnormality occurs during the operation of the CNC machine tool, some fault data can be saved in the system log. In , the fault data mainly refers to the fault alarm information and prompt information in the fault log, which is divided into two types: CNC system alarm prompt and servo alarm prompt. The CNC system also provides a custom log function, that is, the user can customize the configuration of the log content to be generated according to the needs. For example, it can be co...

Claims


Application Information

Patent Timeline
Patent Type & Authority Applications(China)
IPC IPC(8): G05B19/406
CPCG05B19/4068
Inventor 金健张治翰张航军张帆程伊颖
Owner HUAZHONG UNIV OF SCI & TECH
Why Eureka
Try Eureka