Spectrum signal denoising method based on Hilbert-Huang transformation

A yellow transform and signal technology, which is applied in the direction of material analysis, measuring device, and instrument by optical means, can solve the problem of lack of adaptability of wavelet analysis.

Active Publication Date: 2015-12-30
四川安好众泰科技有限公司
View PDF4 Cites 10 Cited by
  • Summary
  • Abstract
  • Description
  • Claims
  • Application Information

AI Technical Summary

Problems solved by technology

However, the spectral signal is inevitably affected by light scattering and has certain nonlinearity. For the denoising of nonlinear and non-stationary signals, wavelet transform is still powerless.
In addition, the wavelet decomposition algorithm needs to set parameters such as wavelet base, number of decomposition layers, and threshold. The selection of parameters directly affects the denoising effect. Denoising lacks adaptability

Method used


Image

  • Spectrum signal denoising method based on Hilbert-Huang transformation
  • Spectrum signal denoising method based on Hilbert-Huang transformation
  • Spectrum signal denoising method based on Hilbert-Huang transformation

Examples


Embodiment 1

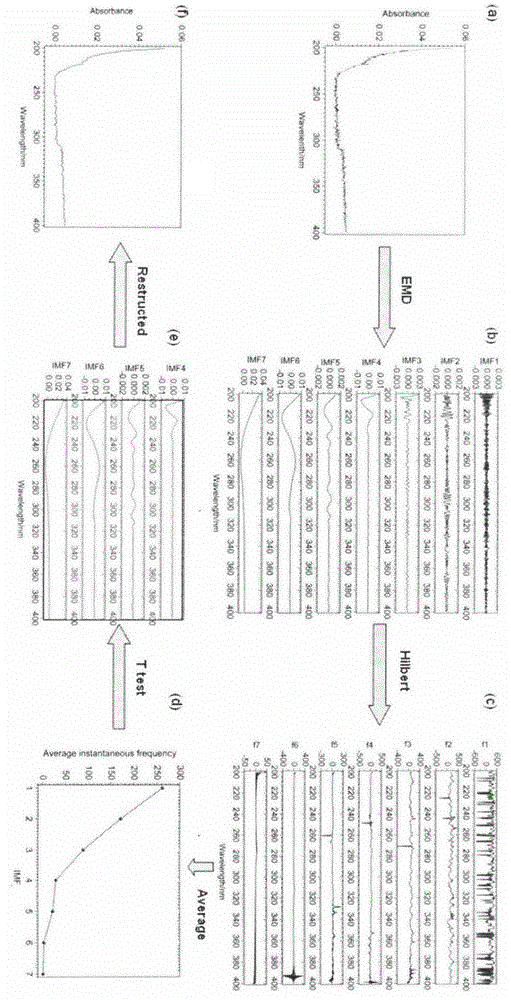
[0016] In this embodiment, the ultraviolet spectrum signal of fuel oil is denoised. The data is provided by Wentzell et al., and the download website is http: / / myweb.dal.ca / pdwentze / downloads.html. The ultraviolet spectrum is measured by a Cary3UV-visible spectrophotometer (VarianInstruments, SanFernando, Calif.), the wavelength range is 200-400nm, the sampling interval is about 0.35nm, and there are 572 wavelength points in total. The original spectrum is as follows: figure 1 As shown in (a), it can be seen from the figure that the signal has obvious noise information.

[0017] (1) Perform empirical mode decomposition on the original signal to obtain 7 IMF components, such as figure 1 as shown in (b);

[0018] (2) Hilbert transform is performed on the 7 IMF components respectively to obtain 7 instantaneous frequency f components, such as figure 1 as shown in (c);

[0019] (3) average each instantaneous frequency f to obtain the average instantaneous frequency, 7 average in...

Embodiment 2

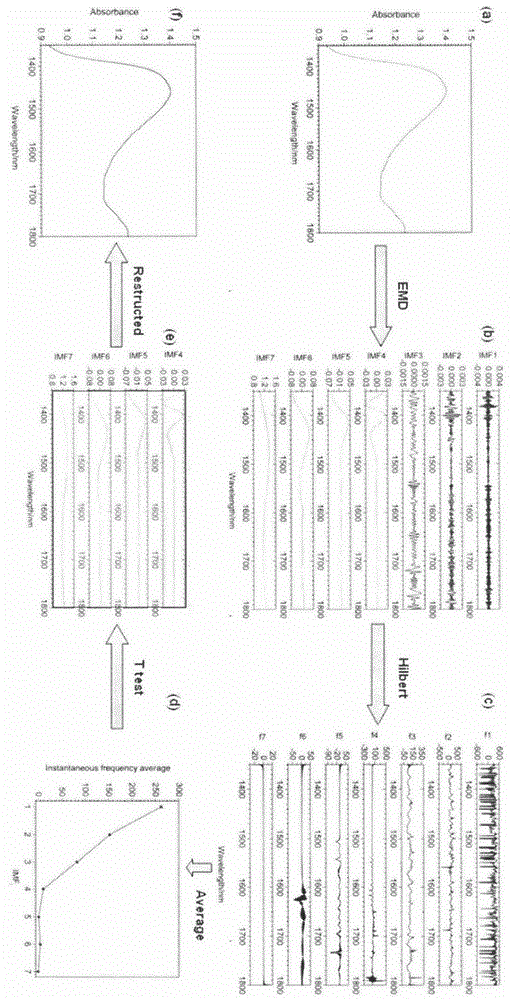
[0024] In this embodiment, the near-infrared spectrum signal of milk is denoised. The sample is Tianjin Haihe brand pure milk. The near-infrared spectrum is measured by a portable laser near-infrared spectrometer (XL-410, American Axsun Technology Co., Ltd.), with a wavelength range of 1350-1800nm. The interval is 0.5nm, the number of variables is 901, and the original spectrum is as figure 2 (a) shown.

[0025] (1) Perform empirical mode decomposition (EMD) on the original signal to obtain 7 IMF components, such as figure 2 as shown in (b);

[0026] (2) Perform Hilbert transform on the 7 IMF components respectively to obtain 7 instantaneous frequency f components, such as figure 2 as shown in (c);

[0027] (3) average each instantaneous frequency f to obtain the average instantaneous frequency, 7 average instantaneous frequency values ​​such as figure 2 as shown in (d);

[0028] (4) Utilize adjacent average instantaneous frequency to carry out t test successively, fi...

Embodiment 3

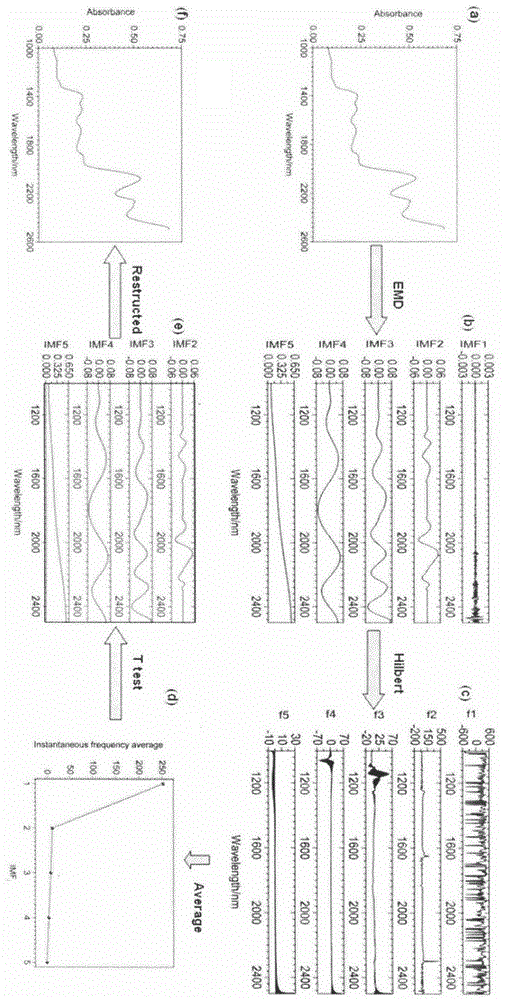
[0031] In this example, denoising is carried out on the near-infrared spectrum signal of orange juice. The data is provided by MarcMeurens, and the download website is: http: / / www.ucl.ac.be / mlg. The wavelength range of the near-infrared reflection spectrum is 1000-2498nm, the sampling interval is 2nm, including 700 wavelength points, the original spectrum is as follows image 3 (a) shown.

[0032] (1) The original signal is subjected to empirical mode decomposition to obtain 5 IMF components, such as image 3 as shown in (b);

[0033] (2) Perform Hilbert transform on the 5 IMF components respectively to obtain 5 instantaneous frequency f components, such as image 3 as shown in (c);

[0034] (3) average each instantaneous frequency f to obtain the average instantaneous frequency, and the five average instantaneous frequency values ​​are as follows image 3 as shown in (d);

[0035] (4) Utilize adjacent average instantaneous frequency to carry out t test successively, find...


PUM


Abstract

The invention relates to a spectrum signal denoising method based on Hilbert-Huang transformation. The method mainly comprises the steps of performing empirical mode decomposition on an original spectrum signal to obtain a series of IMF (intrinsic mode function) components; performing Hilbert transformation on each IMF component to obtain the instant frequency corresponding to each IMF; calculating the average value of the instant frequencies, and adopting t inspection to determine the boundary point k of a signal region and a noise region; finally performing adduction reconstruction on the IMF after the k to obtain a denoised spectrum signal. The method provided by the invention has the advantages that the parameter setting is not needed; the signal can be denoised in a complete self-adaption way; the denoising effect on nonlinear and non-stable spectrum signals is good. The spectrum signal denoising method is applicable to the denoising of complicated substance spectrum signals of petroleum, tobacco, traditional Chinese medicine, food and the like.

Description

technical field [0001] The invention of the method belongs to the field of analytical chemical signal processing, and in particular relates to a spectral signal denoising method based on Hilbert-Huang transformation. Background technique [0002] Spectral analysis technology is widely used in traditional Chinese medicine, food, environment and other fields because of its advantages of rapidity, non-destructiveness, low cost, safety and reliability. However, due to the influence of temperature, humidity, electrical noise and other external environments, besides the useful signal, the data collected by the spectrometer will inevitably get many irrelevant noise signals. In spectral analysis, if these irrelevant noises are not eliminated, they will affect or even cover up the real signal, thereby affecting the quality of the calibration model and the accuracy of predicting unknown samples. Therefore, before signal analysis, it is of great significance to eliminate irrelevant no...

Claims


Application Information

Patent Timeline
Patent Type & Authority Applications(China)
IPC IPC(8): G01N21/3577G01N21/359
Inventor 卞希慧李明李淑娟魏俊富赵俊
Owner 四川安好众泰科技有限公司
Why Eureka
Try Eureka