Identification method, correction method and alarm method for turbidimetry abnormal reaction curve
An abnormal response and response curve technology, applied in the medical field, can solve problems such as bubble generation, identification, and failure to consider the abnormal response curve of whole blood C-reactive protein, so as to achieve the effect of improving accuracy
- Summary
- Abstract
- Description
- Claims
- Application Information
AI Technical Summary
Problems solved by technology
Method used
Image
Examples
example 1
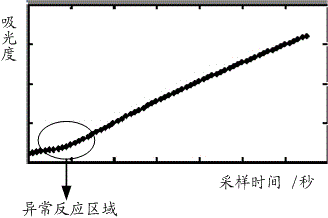
[0141] Whole blood C-reactive protein detection equipment is the BC-5390 blood cell analyzer produced by Shenzhen Mindray Biomedical Electronics Co., Ltd. The first test of C-reactive protein detection is performed on a patient's blood sample. The response curve is as follows Figure 6A As shown, the corresponding C-reactive protein is: 4.4mg / L.
[0142] According to the identification method of the embodiment of the present invention, the abnormal identification of the reaction curve is carried out, wherein, the identification of the abnormal point of the first order difference is as follows: Figure 6C As shown, the second-order difference outlier identification is as follows Figure 6D As shown, the third-order difference outlier identification is as follows Figure 6E As shown, the ratio of abnormal points Ratio_A identified by the first-order difference, second-order difference, and third-order difference is 48.18%.
[0143] In this instrument, the second threshold ψ is...
example 2
[0148] Whole blood C-reactive protein detection equipment is the BC-5390 blood cell analyzer produced by Shenzhen Mindray Biomedical Electronics Co., Ltd. The first test of C-reactive protein detection is performed on a patient's blood sample. The response curve is as follows Figure 7A As shown, the corresponding C-reactive protein is: 3.5mg / L.
[0149] According to the identification method of the embodiment of the present invention, the abnormal identification of the reaction curve is carried out, wherein, the identification of the abnormal point of the first order difference is as follows: Figure 7C As shown, the second-order difference outlier identification is as follows Figure 7D As shown, the third-order difference outlier identification is as follows Figure 7E As shown, the ratio of abnormal points Ratio_A identified by the first-order difference, second-order difference, and third-order difference is 59.12%.
[0150] In this instrument, the second threshold ψ is...
PUM
 Abstract
Description
Claims
Application Information
 - R&D
- Intellectual Property
- Life Sciences
- Materials
- Tech Scout
- Unparalleled Data Quality
- Higher Quality Content
- 60% Fewer Hallucinations
Browse by: Latest US Patents, China's latest patents, Technical Efficacy Thesaurus, Application Domain, Technology Topic, Popular Technical Reports.
© 2025 PatSnap. All rights reserved.Legal|Privacy policy|Modern Slavery Act Transparency Statement|Sitemap|About US| Contact US: help@patsnap.com


