Sensitivity compensation method of defects in defocusing area of ultrasonic focusing probe

A technology of sensitivity compensation and ultrasonic focusing, which is applied in the direction of material analysis, measuring devices, and instruments using sound waves/ultrasonic waves/infrasonic waves, which can solve problems such as misjudgment, low detection sensitivity, and uncertain depth of internal defects, etc. Avoid misjudgment, accurate evaluation, high precision and repeatable effect

Active Publication Date: 2016-06-15
UNIV OF SCI & TECH BEIJING
4 Cites 9 Cited by

AI-Extracted Technical Summary

Problems solved by technology

[0004] When performing internal defect detection on a test piece, since the depth of the internal defect is uncertain, the ideal focus position cannot be preset to ensure that all defects can be located in the fo...

Abstract

The invention provides a sensitivity compensation method of defects in the defocusing area of an ultrasonic focusing probe.The sensitivity compensation method is characterized in that sensitivity compensation curves are actually measured by manufacturing compensation samples, the ultrasonic echo data of the to-be-measured samples is acquired through an ultrasonic microscope, the X, Y and Z spatial coordinates of the defects are extracted, corresponding compensation curves are selected according to actual detecting conditions, and sensitivity compensation is completed according to the depths Hdefect of the defects and the positions Hfocus of focuses.The sensitivity compensation method has the advantages that the detecting sensitivity of the defects in the defocusing area of the focusing probe is achieved; compared with AVG curves of flat probes, the method is more suitable for the focusing probe, the sensitivity compensation of the defects of the defocusing area is achieved, high precision and repeatability are achieved, the method is significant to fast defect detection and defect size representation, and misjudgment of defect size is avoided; by the sensitivity compensation, the defect size and number in materials can be statistically analyzed, and the purity of metal materials can be evaluated accurately.

Application Domain

Material analysis using sonic/ultrasonic/infrasonic waves

Technology Topic

PhysicsMicroscope +4

Image

  • Sensitivity compensation method of defects in defocusing area of ultrasonic focusing probe
  • Sensitivity compensation method of defects in defocusing area of ultrasonic focusing probe
  • Sensitivity compensation method of defects in defocusing area of ultrasonic focusing probe

Examples

  • Experimental program(1)

Example Embodiment

[0030] In order to make the object, technical solution and advantages of the present invention clearer, the present invention will be further described in detail below in conjunction with the accompanying drawings and embodiments. It should be understood that the specific embodiments described here are only used to explain the present invention, not to limit the present invention. On the contrary, the invention covers any alternatives, modifications, equivalent methods and schemes within the spirit and scope of the invention as defined by the claims. Further, in order to make the public have a better understanding of the present invention, some specific details are described in detail in the detailed description of the present invention below. The present invention can be fully understood by those skilled in the art without the description of these detailed parts.
[0031] The present invention will be further described below in conjunction with the accompanying drawings and specific embodiments, but not as a limitation of the present invention. The best embodiment of the present invention is enumerated below:
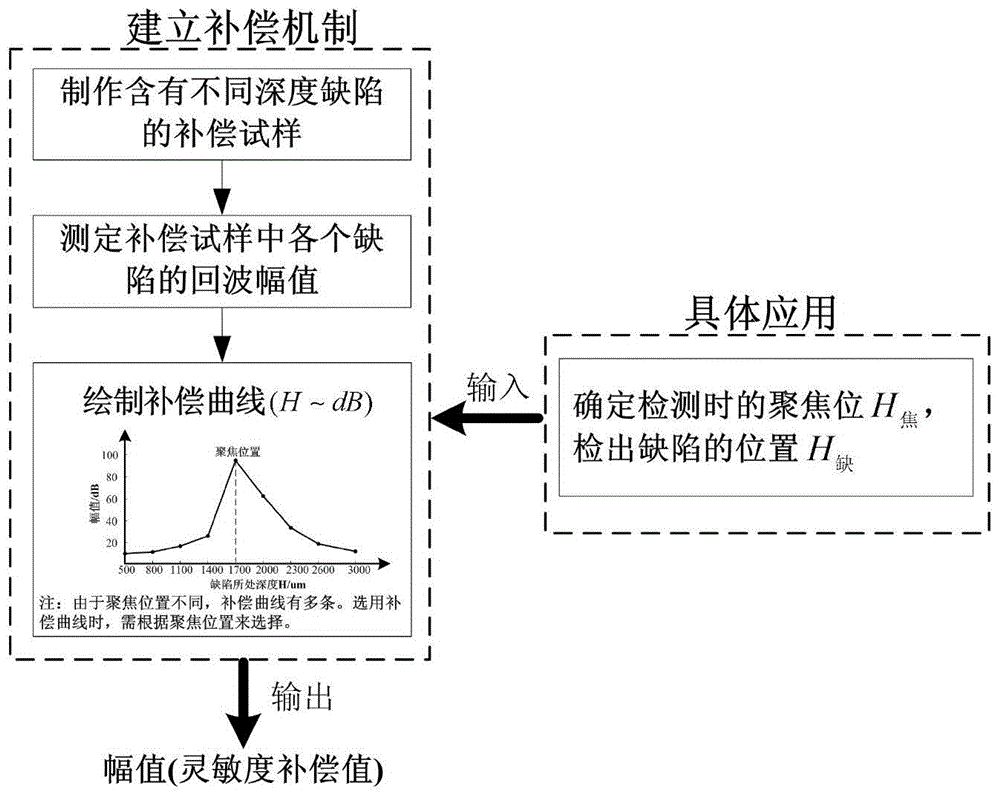
[0032] like figure 1 As shown, the sensitivity compensation method for defects in the defocusing area of ​​the ultrasonic focusing probe, the method aims at the problem of low detection sensitivity when the defect is in the defocusing area of ​​the focusing probe, by drawing the echoes of the same defect at different depths along the probe axis Amplitude curve, establish a compensation mechanism, and compensate the actual data of the defect echo in the defocus area. When compensating, different coefficients are used for compensation according to the distance of the actual defect away from the focus of the probe, so that the sensitivity of the defect in the defocus area reaches its level when it is in focus. Described method mainly comprises the following steps:
[0033] Step 1, designing and manufacturing the compensation test block: using the bearing steel material to make a "wing-shaped" ladder sample with 9 steps, such as figure 2 shown. The sample thickness is 3000um, the initial step (step 1) is 500um thick, and the thickness difference between each step is 300um. Each step is used to simulate a large flat-bottom defect. The size of the large flat-bottom defect is much larger than the focal column diameter of the focusing probe, so it can be Regardless of the size of the defect, it is guaranteed that only the depth of the defect differs.
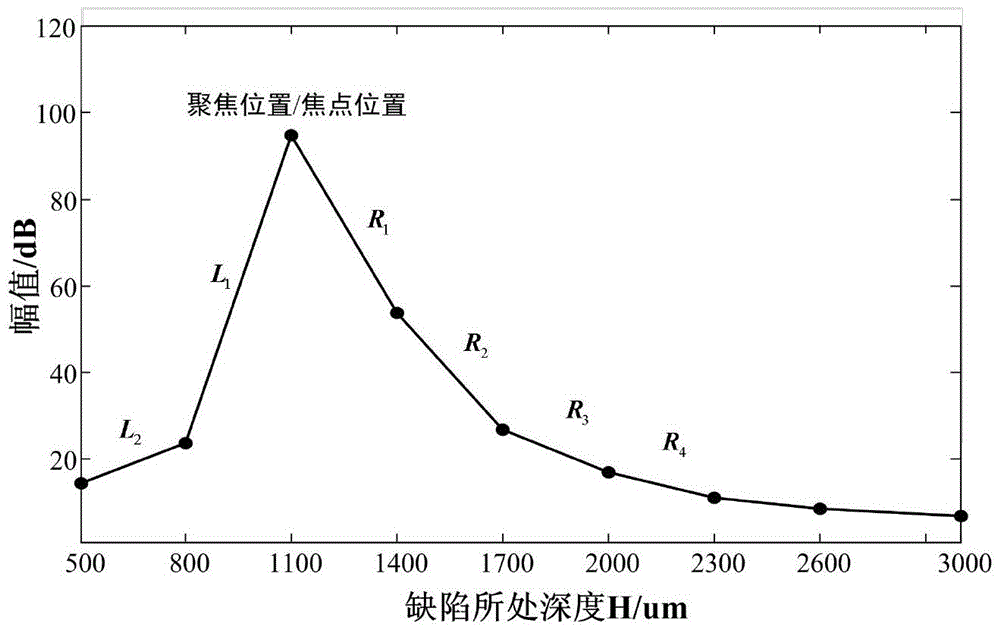
[0034] Step 2, draw the sensitivity compensation curve: when drawing the compensation curve, the gain should be kept constant, focus the probe on a certain step, move the probe to collect echoes on different steps in sequence, and draw the sensitivity compensation curve. The x-axis of the curve represents the defect depth, and the y-axis represents the echo amplitude of the defect. It should be noted that there is a one-to-one correspondence between the depth of focus and the compensation curve, and different compensation curves are drawn for different depths of focus. For compensation curves focused at a depth of 1100um, such as image 3 As shown in the figure, the amplitude of the curve at the focus position is the highest, and the amplitude of the curves on the left and right sides away from the focus position decreases. In the figure, the x-axis from left to right is the direction of gradual increase in depth, and the slope of the curve on the left side of the focus position is represented by L i Indicates; the slope of the curve on the right side of the focus position is represented by R i express.
[0035] Step 3, ultrasonic data acquisition of the sample to be tested: samples with internal defects such as Figure 4 As shown, the sample thickness is 1800um. When testing it, a 30MHz focusing probe is used, the wafer diameter is 6mm, the focal length is 12.7mm, the theoretical focal column length is 225um, and the focal column diameter is 106um. First, focus on the inside of the sample to be tested, and scan the entire sample with a larger step value to obtain a C-scan image of the internal defects of the entire sample, and then find the target to be analyzed in the C-scan image The target area, and then carry out precise scanning with a smaller step value, and save the full-wave data.
[0036] Step 4, defect location coordinate extraction: According to the echo signal of the defect, extract the X, Y, Z space physical coordinates of the defect location, the scanning method is to scan along the equidistant parallel lines along the X direction, and all the scanning points are m ×n matrix arrangement, where m is the number of scans on parallel lines, and n is the number of scan points on each parallel line. According to the scanning principle, the X and Y coordinates of the defect can be determined first, and then according to the principle of longitudinal wave propagation, ultrasonic waves propagate in the material along the vertical direction, through the formula Among them, c is the propagation speed of ultrasonic waves in the material, t is the time from the echo of the clamped defect in the A-scan waveform to the interface wave, H 缺It represents the depth position of the defect. After ultrasonic testing, there are two defects with different depths inside the material. Through calculation, the depth of shallow defects is F 1 =1122um, the depth of deep defect is F 2 =1449um. Take the deep defect as the target to analyze the defect, and the acquisition focus is at a depth of H 焦 =1122um data as the data to be analyzed, the test results are as follows Image 6 shown; the acquisition focus is at a depth of H 焦 The data when =1449um is used as the actual measured data under ideal conditions, and compared with the compensation results, the test results are as follows Figure 7 shown.
[0037] Step 5, Defect detection sensitivity compensation: the process of using the compensation curve is as follows Figure 5 As shown, when compensating the detection sensitivity of a certain defect, the position H of the current probe focus must first be determined 焦 and the depth H of the defect 缺 , select the compensation curve according to the position of the focus, and then judge the relative position between the defect and the focus according to the distance difference ΔH between the two, and further select the corresponding compensation coefficient. When the defect is above the focal point, ie ΔH=H 焦 -H 缺0, the curve to the left of the focus is used for compensation. When the defect is below the focal point, that is, ΔH=H 焦 -H 缺 <0, the curve on the right side of the focus is used for compensation; then, the compensation value is calculated according to the size of ΔH, and the calculation of the compensation value adopts a segmented calculation method, and the final result is accumulated to complete the sensitivity compensation. For the data to be analyzed measured in this paper, the focal depth of the probe is H 焦 =1122um, so choose the compensation curve when focusing on step 3, that is image 3 curve in . Meanwhile, the actual depth of the defect is H 缺 =F 2 =1449um, get the distance difference between focus and defect ΔH=H 焦 -H 缺 =-327um, since ΔH<0, the defect is in the defocus area below the focus position, so the right half of the compensation curve is selected, and its slope is R 1 = 0.12333dB/um, R 2 = 0.09000 dB/um. After calculation, the sensitivity compensation results of deep defects are as follows: Figure 8 shown.
[0038] The embodiments described above are only one of the more preferred specific implementations of the present invention, and the usual changes and replacements performed by those skilled in the art within the scope of the technical solutions of the present invention should be included in the protection scope of the present invention.

PUM

no PUM

Description & Claims & Application Information

We can also present the details of the Description, Claims and Application information to help users get a comprehensive understanding of the technical details of the patent, such as background art, summary of invention, brief description of drawings, description of embodiments, and other original content. On the other hand, users can also determine the specific scope of protection of the technology through the list of claims; as well as understand the changes in the life cycle of the technology with the presentation of the patent timeline. Login to view more.

Similar technology patents

Continuous zoom lens with linear motor and self-locking function

ActiveCN110007422AHigh precision and repeatabilityless parts
Owner:DONGGUAN POMEAS PRECISION INSTR

Failure detecting method for relay in inverter

InactiveCN108303644Aavoid misjudgment
Owner:JIANGSU EVER SOLAR NEW ENERGY CO LTD

Identification method, system and device, and readable storage medium

InactiveCN108445324Aavoid misjudgmentReduced complexity and equipment cost
Owner:杭州讯能科技有限公司

Marking-assisted answer sheet

InactiveCN104859344AMapping is accurateavoid misjudgment
Owner:秦健

Classification and recommendation of technical efficacy words

  • avoid misjudgment
  • High precision and repeatability

On-line diagnosis and control method for knockings of internal-combustion engine

InactiveCN102735395Aavoid misjudgmentOvercome the Neglect of the Frequency Characteristics of the Pressure in the Cylinder
Owner:TIANJIN UNIV

Integrated dynamic weighing system for rectifying illegal driving and method

ActiveCN103852147AEliminate non-return to zero horizontal force in one directionavoid misjudgment
Owner:BEIJING WANJI TECH

Short circuit determination method for electrode fused arc welding

ActiveCN101513689Aavoid misjudgmentWelding state is stable
Owner:DAIHEN CORP

Continuous zoom lens with linear motor and self-locking function

ActiveCN110007422AHigh precision and repeatabilityless parts
Owner:DONGGUAN POMEAS PRECISION INSTR
Why Eureka
Try Eureka