
Seismic data three-dimensional display method based on surface subdivision

A technology for seismic data and surface subdivision, which is applied in seismology, seismic signal processing, geophysical measurement, etc., and can solve problems such as seismic data index connection problems

Active Publication Date: 2016-06-15
BEIJING UNIV OF TECH
View PDF4 Cites 9 Cited by
  • Summary
  • Abstract
  • Description
  • Claims
  • Application Information

AI Technical Summary

Problems solved by technology

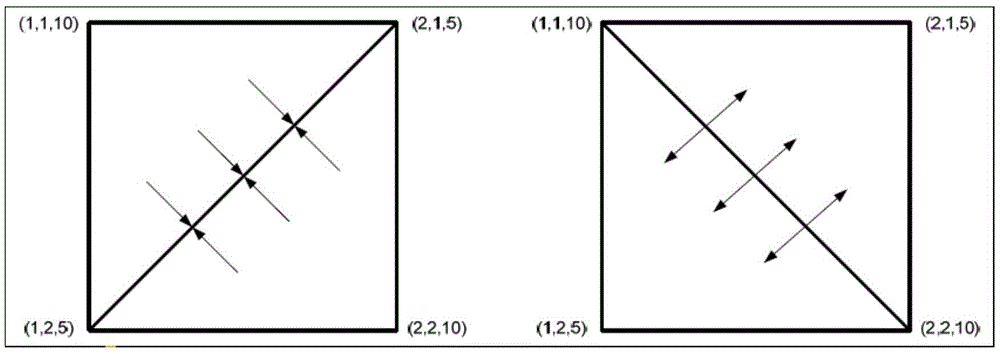
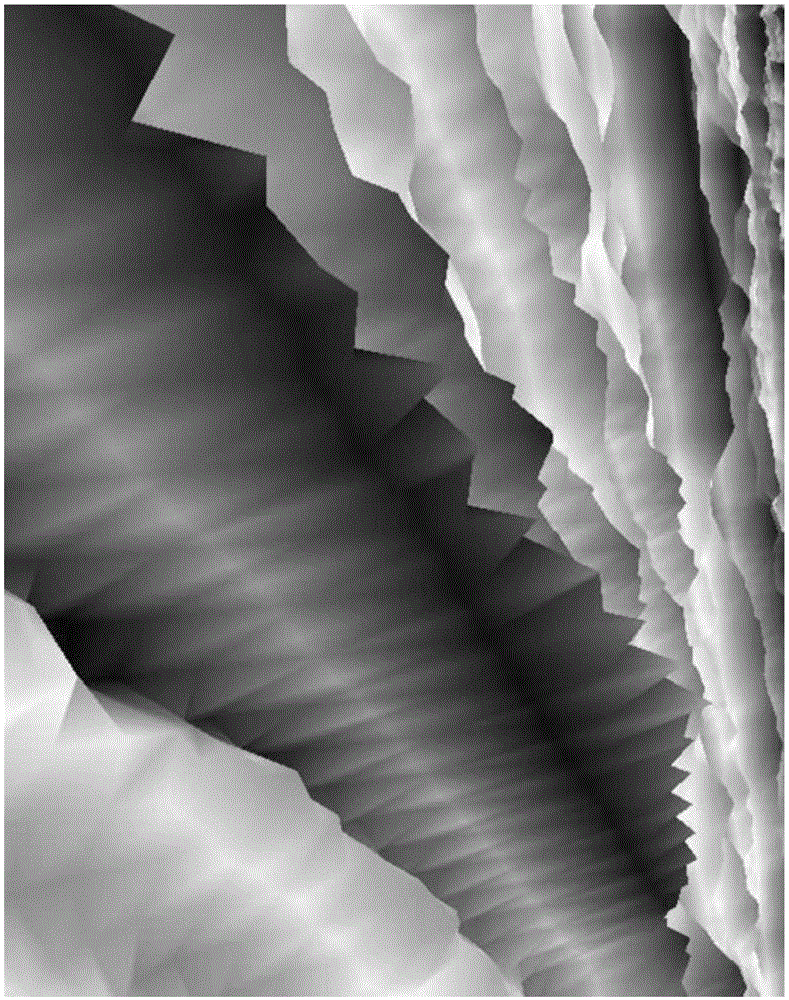
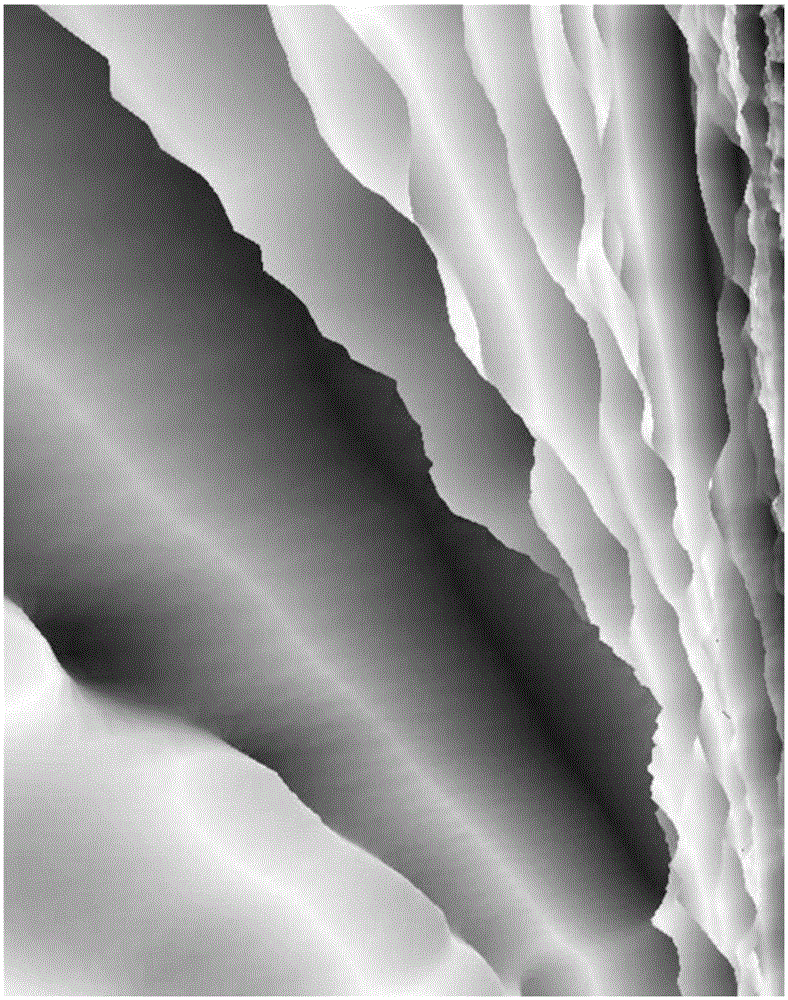
[0006] Purpose of the invention: to solve the index connection problem when seismic data is gridded and the gridding problem when observing at close range

Method used


Image

  • Seismic data three-dimensional display method based on surface subdivision
  • Seismic data three-dimensional display method based on surface subdivision
  • Seismic data three-dimensional display method based on surface subdivision

Examples


Embodiment Construction

[0062] The present invention will be further described below in conjunction with the accompanying drawings.

[0063] Figure 8 Be a flowchart of the present invention, carry out as follows in computer:

[0064] Step (1), analysis of seismic data in SEG-Y format:

[0065] Seismic data in SEG-Y format generally includes three parts, namely EBCDIC file header, binary file header and seismic trace, such as Figure 9 shown. Use N to represent the Nth data track of the data body, then the Nth track head and track data reading positions are respectively:

[0066] 3600+(N-1)(240+sample_num*data_size)

[0067] 3600+(N-1)(2400+sample_num*data_size)+240

[0068] The SEG-Y structure is the same, because the data storage format of the microcomputer and the workstation are different, the high byte of the workstation is in front, and the low byte is in the back, while the microcomputer is in the low byte, and the high byte is in the back. High and low data exchange is required when rea...


PUM


Abstract

The invention belongs to the field of computer graphics and data visualization and relates to a seismic data three-dimensional display method based on surface subdivision. The seismic data three-dimensional display method is realized by utilizing a Directx11 programming tool and based on a third-order Bessel surface subdivision algorithm. For prepared vertex buffer, a GPU is set to enable control points to be assembled in a surface patch manner, so that index buffer is not needed, and the problem of grooves and ridges generated in the process of determining the index buffer is prevented; and besides, through the application of the surface subdivision technology based on GPU programming, more control points are generated, and display of a grid is allowed to be finer and smoother and have better real-time performance.

Description

technical field [0001] The invention belongs to the field of computer graphics and data visualization, and relates to a three-dimensional display method of seismic data based on surface subdivision. Background technique [0002] With the application and development of seismic exploration technology, prospectors have higher and higher requirements for seismic interpretation results. With the development of computer hardware, especially the rapid development of GPU, 3D display technology of seismic data has been paid more and more attention. Traditional seismic data display methods: waveform display, gray scale variable density display, and color variable density display are all two-dimensional display methods, which cannot provide multiple angles to observe seismic data, and often this type of seismic data interpretation system will lose many details. [0003] In 2008, Dr. Steven Lynch proposed a three-dimensional display method for seismic data sections in his doctoral diss...

Claims


Application Information

Patent Timeline
Patent Type & Authority Applications(China)
IPC IPC(8): G01V1/34
CPCG01V1/345
Inventor 何震震肖创柏禹晶
Owner BEIJING UNIV OF TECH
Learn More