Eureka AIR delivers breakthrough ideas for toughest innovation challenges, trusted by R&D personnel around the world.

Vision mapping method based on mixed group regression method

A regression method and a mapping method technology, applied in the field of computer vision, can solve the problems of insufficient modeling and solution methods, in the initial stage and so on

Inactive Publication Date: 2016-07-13
UNIV OF ELECTRONIC SCI & TECH OF CHINA
View PDF3 Cites 16 Cited by
  • Summary
  • Abstract
  • Description
  • Claims
  • Application Information

AI Technical Summary

Problems solved by technology

However, most of the existing research work has shortcomings in modeling and solution methods, and further research and improvement are needed.
In addition, a small amount of domestic research work has also begun to appear in this field, but most of the research is still in its infancy

Method used


Image

  • Vision mapping method based on mixed group regression method
  • Vision mapping method based on mixed group regression method
  • Vision mapping method based on mixed group regression method

Examples


Embodiment Construction

[0072] The technical scheme of the present invention is a kind of visual mapping method based on mixed group regression method, and concrete steps are as follows:

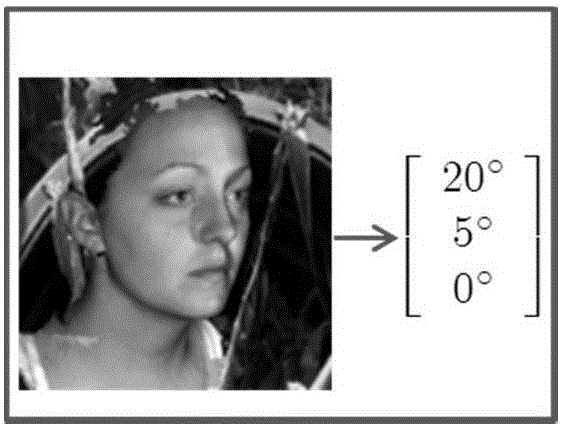
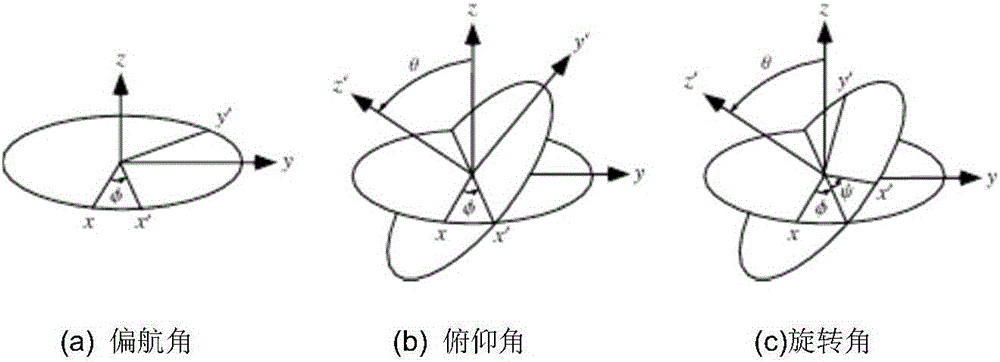
[0073] Step 1: Collect N head images containing different poses (see figure 1 ), and according to the head pitch, yaw and rotation angles corresponding to each image when each image was collected (see figure 2 ), the head pose make a note, y n The first dimension of represents the pitch angle, the second dimension represents the tilt angle, the third dimension represents the rotation angle, and the subscript n represents the attitude corresponding to the nth image;

[0074] Step 2: Convert the color image to a grayscale image. If the collected image is already a grayscale image, no conversion is required;

[0075] Step 3: Normalize the size of the head region of the image obtained in step 2 to 64×64 pixels, and extract the gradient orientation histogram feature (Histogram of Oriented Gradient, HOG); in the pr...


PUM


Abstract

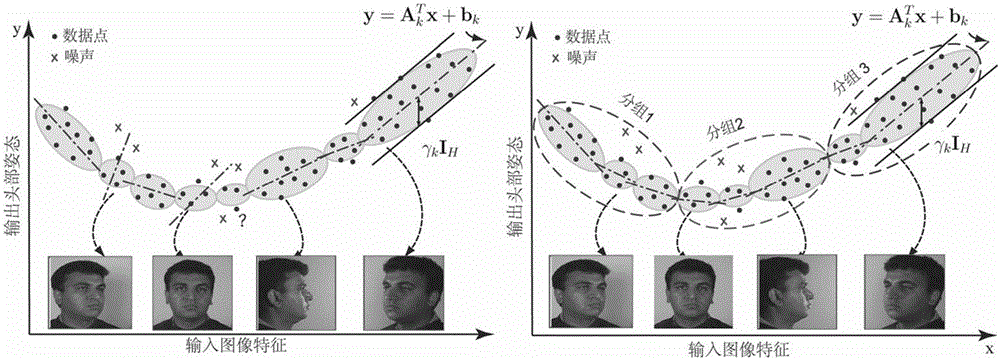
The invention discloses a vision mapping method based on a mixed group regression method, belongs to the technical field of computer vision, relates to mixed regression technology, and exemplifies the vision mapping method with a head attitude estimation problem. The method comprises steps of: extracting a gradient direction histogram feature from an acquired head image and recording a corresponding head attitude; establishing a mixed group regression model between an input gradient direction histogram and the corresponding head attitude; initializing the mixed group regression model, setting groups according to an initialized clustering center, and solving a regression parameter; and extracting the gradient direction histogram feature of a given head image to be estimated and estimating the head attitude by using the learned mixed group regression model. The method improves the robustness of head attitude estimation.

Description

technical field [0001] The invention belongs to the technical field of computer vision, relates to hybrid regression technology, and is mainly applied to visual estimation problems such as attitude estimation, line of sight tracking and age estimation. Background technique [0002] In computer vision, visual mapping refers to the process of learning a mapping function between input image features and output variables, so that when a new image is input, the target output value corresponding to the input image is estimated. Specifically, visual mapping includes: human body pose estimation, head pose estimation, line of sight estimation, and object tracking. See references for details: O. Williams, A. Blake, and R. Cipolla, Sparse and Semi-supervised Visual Mapping with the S3GP, in IEEE Conference Computer on Computer Vision and Pattern Recognition, pp.230-237, 2006. [0003] As an important branch of computer vision, visual mapping has changed the situation where humans esti...

Claims


Application Information

Patent Timeline
IPC IPC(8): G06K9/62
CPCG06F18/2321G06F18/214
Inventor 潘力立王正宁郑亚莉
Owner UNIV OF ELECTRONIC SCI & TECH OF CHINA
Why Eureka
Eureka Blog
Learn More