Simulated analysis and image display method of digital map of sky visible range

A technology of analog analysis and digital map, applied in image data processing, 3D modeling, instruments, etc., can solve problems such as errors, achieve the effect of avoiding errors, good technical platform, and reducing errors

Active Publication Date: 2016-07-13
SOUTHEAST UNIV
View PDF3 Cites 11 Cited by
  • Summary
  • Abstract
  • Description
  • Claims
  • Application Information

AI Technical Summary

Problems solved by technology

The advantage is that relevant data can be obtained quickly; the disadvantage is that it is somewhat divorced from the actual situation, but the ideal data may have errors from the real situation

Method used


Image

  • Simulated analysis and image display method of digital map of sky visible range
  • Simulated analysis and image display method of digital map of sky visible range
  • Simulated analysis and image display method of digital map of sky visible range

Examples


Embodiment Construction

[0034] Below in conjunction with accompanying drawing and specific embodiment, further illustrate the present invention, should be understood that these embodiments are only for illustrating the present invention and are not intended to limit the scope of the present invention, after having read the present invention, those skilled in the art will understand various aspects of the present invention Modifications in equivalent forms all fall within the scope defined by the appended claims of this application.

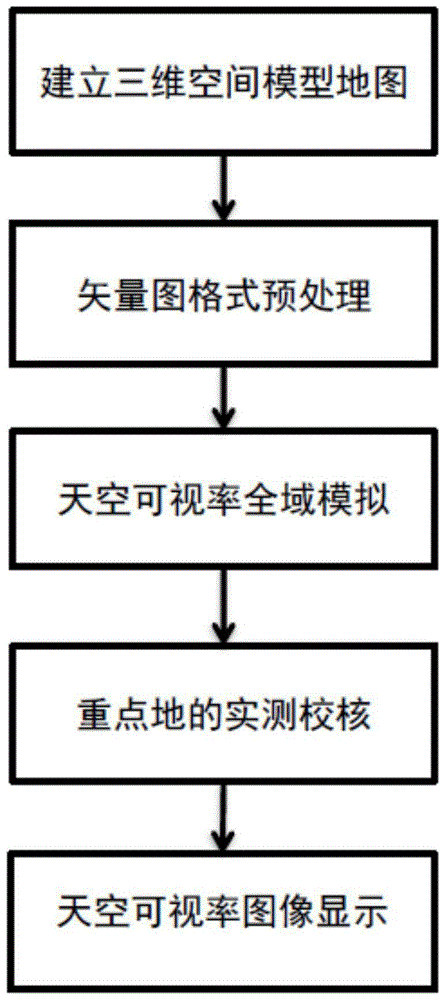
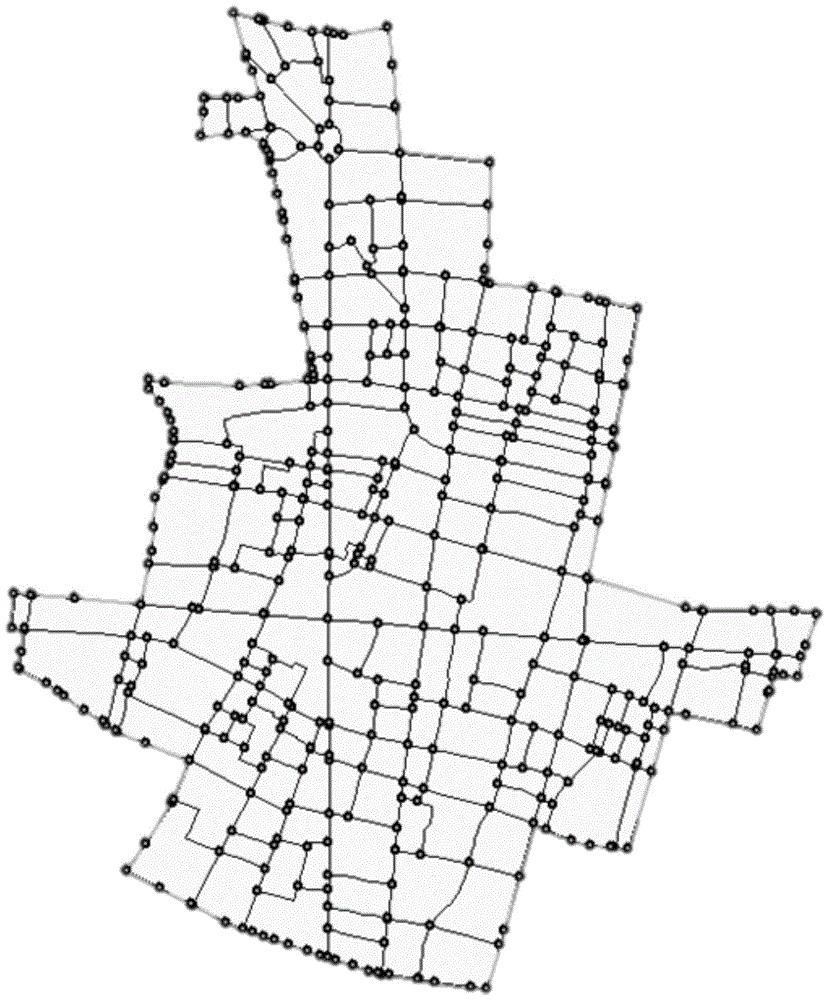
[0035] The present invention aims at the errors caused by the shortcomings of the traditional analysis methods of the visible sky domain, and proposes a simulation analysis method for the visible domain of the sky, which consists of the following steps: determine the geographic location information of the research area, obtain and store the information in the research area The 3D vector information of all the buildings in the building, through rasterization processing, th...


PUM


Abstract

The invention discloses a simulated analysis and image display method of a digital map of the sky visible range. Geographic position information of a research area is determined, 3D vector information of all buildings in the research area is obtained and stored, and gridding is used to preprocess building data by format conversion; multiple observation points are selected from the whole research area and used to scan all the buildings in the research area for 360 degree, the maximal elevation angle and the average elevation angle are calculated, and further, the average sky visible rates of all the observation points in the whole research area are calculated; if the difference between the average sky visible rate of certain observation point and that of an adjacent observation point is greater than a threshold, the observation point is checked by actual measurement, and the actual measurement value of the observation point is taken as the correct the average sky visible rate; and software ArcGIS is used to carry out interpolation operation on the average sky visible rate of all the observation points to obtain a corrected simulation graph of the sky visible range.

Description

technical field [0001] The invention belongs to the technical field of urban planning, and relates to a simulation analysis and image display method of a digital map in the visible domain of the sky. Background technique [0002] The research on the visible domain of the sky has multiple perspectives such as the discipline of physical environment, the field of atmospheric science and the discipline of urban planning. The concept of sky visibility refers to the range of the sky that people can see in the urban open space enclosed by buildings. It is related to the multiple influences of urban space quality, public activity comfort and visual psychological expectations. The viewing rate is a quantifiable factor used to study the size of the sky range that affects citizens, and it refers to the ratio of the sky area (A1) observed by the observer at a fixed position to the area of ​​the entire sky domain (A), denoted as ∩; the sky occlusion rate That is, the ratio of the invisi...

Claims


Application Information

Patent Timeline
Patent Type & Authority Applications(China)
IPC IPC(8): G06T17/05
CPCG06T17/05
Inventor 杨俊宴李晋史宜卢华兴
Owner SOUTHEAST UNIV
Why Eureka
Try Eureka