Dynamic data visualized analysis tool based on workflows

A technology of dynamic data and analysis tools, applied in the field of big data analysis, can solve problems such as difficulty in reproducing scientific results, loss of efficiency, failure of visual interface to provide sufficient support for data analysis process, etc.

Inactive Publication Date: 2016-07-27
HANGZHOU NORMAL UNIVERSITY +1
View PDF3 Cites 12 Cited by
  • Summary
  • Abstract
  • Description
  • Claims
  • Application Information

AI Technical Summary

Problems solved by technology

Different applications use different data formats, and scientists will have to adapt to these changes, which will seriously disturb the data analysis process and make it difficult to reproduce some scientific results
Switching back and forth between Matlab and the data analysis process directly introduces the overhead of context switching
[0004] The second problem is that some current visualization implementations require users to choose some encoding methods to establish a mapping between data and tags
But choosing an appropriate mapping

Method used


Image

  • Dynamic data visualized analysis tool based on workflows

Examples


Embodiment Construction

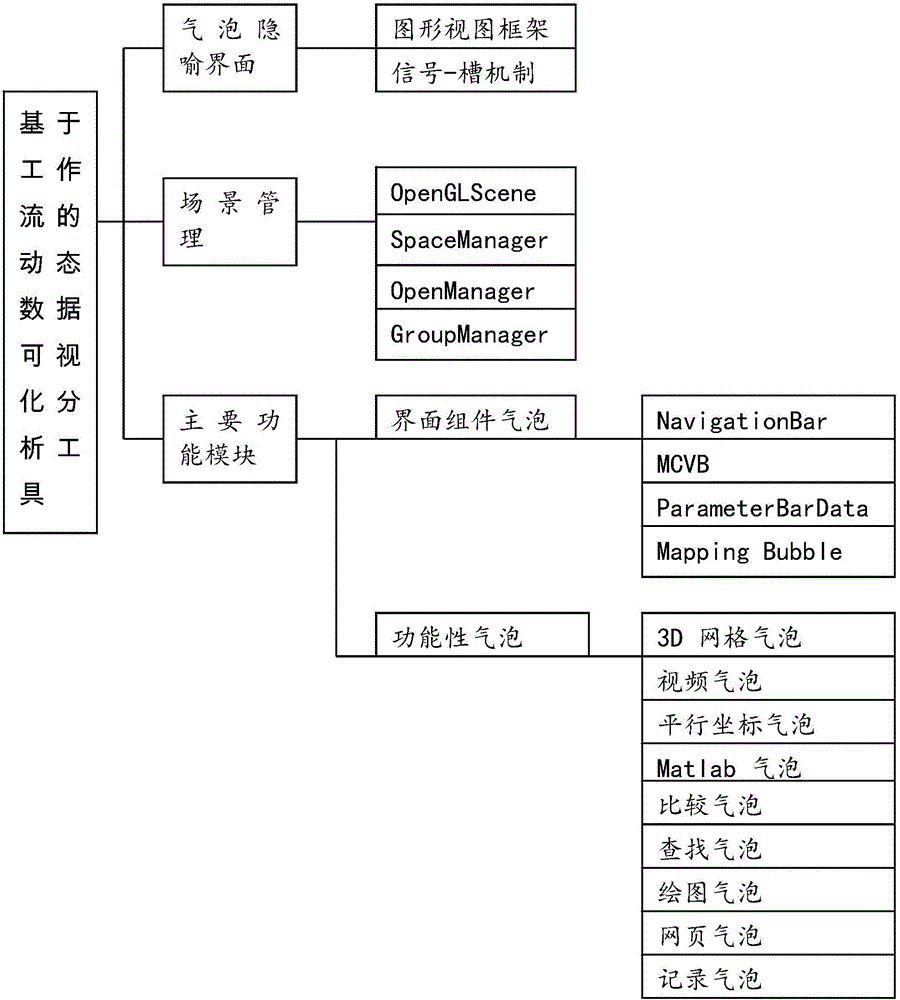
[0038] The technical solutions of the present invention will be clearly and completely described below through specific embodiments in conjunction with the accompanying drawings.

[0039] Please refer to figure 1 , is a workflow-based dynamic data visualization analysis tool in an embodiment of the present invention, including: a bubble metaphor interface, a scene management, and a main function module, wherein the bubble metaphor interface includes a graphic view framework and a signal-slot mechanism; the scene management Some of them include OpenGLScene, SpaceManager, OpenManager, and GroupManager; the core part of the entire system of OpenGLScene is the entry point for all interactive operations. The main functional modules include interface component bubbles and functional bubbles. Interface component bubbles are part of the interface, similar to menus and toolbars in general Windows systems, including NavigationBar, MCVB (Model-Composition-ViewBubble), and ParameterBarDa...


PUM


Abstract

The invention discloses a dynamic data visualization analysis tool based on workflow. The invention extends the static multi-view display to the metaphorical interface of the bubble, so that the data analysis task can be supported by free layout. Each bubble is a functional unit, which can be used for programming calculations, and can also be used to create a visualization instance. It supports the operation of multiple bubbles forming a group, and the operation of bubbles in the same group is unified, which enhances the user experience. The invention can effectively connect different stages of the data analysis pipeline, reduce the efficiency loss of creating visualization instances and program transfer, and improve the efficiency of dynamic data visualization. Transforming causality-based data exploration into a pipelined approach can support transfer between procedures, automation of repetitive tasks, data capture records, and reuse of complex data analysis processes at different levels of detail. Provides more convenience for program pipelines in a broader framework.

Description

technical field [0001] The invention relates to the field of big data analysis, in particular to a workflow-based dynamic data visualization analysis tool. Background technique [0002] We found that some existing workflow tools do not well support the loop of the sense-making process. The meaning construction process of general scientists starts from the completion of data collection and ends with obtaining some meaningful knowledge from the data. The following three issues are mainly considered in the system design: [0003] The first problem is the independent separation of program implementation and data analysis, which forces scientists to switch between multiple working environments. Scientists use Matlab to perform analyzes and then visualize the calculated results to test hypotheses or generate new hypotheses. If they need to do more analysis, they need to switch back to the Matlab environment to make some changes. Different applications use different data format...

Claims


Application Information

Patent Timeline
IPC IPC(8): G06F9/44
CPCG06F9/451
Inventor 潘志庚鲍方云李光霞张明敏
Owner HANGZHOU NORMAL UNIVERSITY
Why Eureka
Try Eureka