Power grid weak link analysis method of based on statistic power flow

A weak link and analysis method technology, applied in computing, instrumentation, data processing applications, etc., can solve the problem of insufficient historical data mining.

Inactive Publication Date: 2016-09-28
STATE GRID TIANJIN ELECTRIC POWER +1
View PDF3 Cites 5 Cited by
  • Summary
  • Abstract
  • Description
  • Claims
  • Application Information

AI Technical Summary

Problems solved by technology

At present, the mining of historical data in power system security analysis is not enough

Method used


Image

  • Power grid weak link analysis method of based on statistic power flow
  • Power grid weak link analysis method of based on statistic power flow
  • Power grid weak link analysis method of based on statistic power flow

Examples


Embodiment Construction

[0025] The method for analyzing weak links of the power grid based on statistical power flow provided by the present invention will be described in detail below in conjunction with the accompanying drawings and specific embodiments.

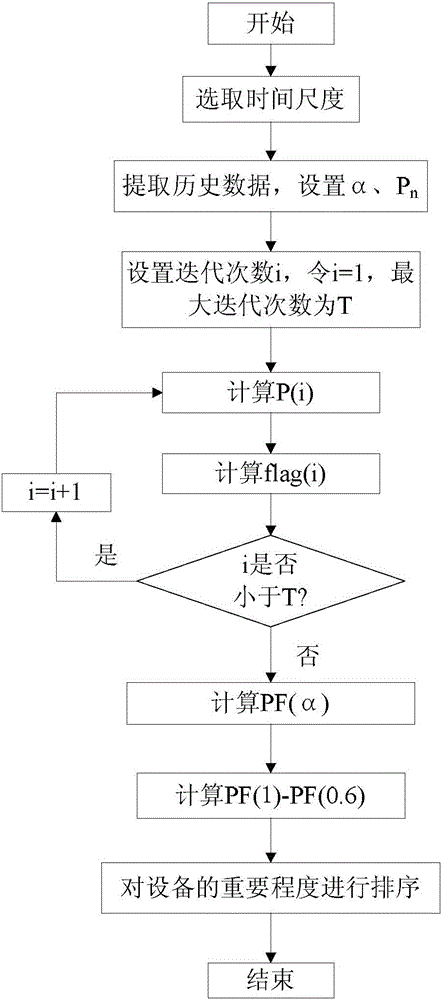
[0026] Such as figure 1 As shown, the method for analyzing weak links of the power grid based on statistical power flow provided by the present invention includes the following steps performed in sequence:

[0027] Step 1) setting the time scale that needs to be analyzed;

[0028] Step 2) Extract the operation history data corresponding to the time scale of each main transformer in the power grid to be analyzed, and set the power flow heavy load coefficient α and the transmission section stability limit Pn;

[0029] Step 3) set the number of iterations as i, make i=1, the maximum number of iterations is T, and T is the total number of minutes included in the time scale;

[0030] Step 4) Calculate the average power flow P(i) of the power transmi...


PUM


Abstract

The invention provides a power grid weak link analysis method of based on statistic power flow. The method includes setting a time scale; extracting the running historical data of each main transformer and setting power flow heavy load coefficients and a power transmission section stable limit; setting iteration frequencies and iteration maximum frequency; calculating the power transmission section power flow mean value; calculating sign functions; calculating the power flow evaluation indexes; calculating the power flow heavy load degree of each main transformer; or sequencing the main transformers based on importance and other steps. According to the invention, the time dimension on the power flow data can be increased and the month or year is selected as the time scale to identify the heavy load degree of the main transformers in a certain period of time, the early peak hours can be used as the time scale to analyze the effect of the early peak on the main transformer load factors, and the time proportions of the power flow heavy load coefficients greater than 60% are sequenced to analyze the importance degree of the main transformers of the equipment, so that the weak link of the power grid can be timely discovered, and the instructions for reasonably arranging the operation ways, maintenance schedules, and power grid planning can be provided.

Description

technical field [0001] The invention belongs to the technical field of power system security analysis, in particular to a method for analyzing weak links of a power grid based on statistical power flow. Background technique [0002] Power flow overload or limit is one of the biggest potential threats to maintain safe operation of the power grid. At present, in the static security analysis, the maximum load rate of the main transformer and line is mainly used to evaluate whether the power grid meets the N-1 requirement. Such traditional power grid indicators cannot reflect the operating status of the equipment over time. At the same time, the power grid has accumulated a large amount of historical data during the long-term operation process, which contains the trend characteristics of power system operation. At present, the mining of historical data in power system security analysis is not enough. Therefore, it is necessary to fully tap the potential value of the historical...

Claims


Application Information

Patent Timeline
Patent Type & Authority Applications(China)
IPC IPC(8): G06Q10/06G06Q50/06
CPCG06Q10/0639G06Q50/06
Inventor 李媛媛王魁闫大威梁群毛华刘树勇周进雷铮刘丽霞罗涛宣文博丁承第宋佳
Owner STATE GRID TIANJIN ELECTRIC POWER
Why Eureka
Try Eureka