Building wind tunnel pressure measurement test data compression method

A technology of test data and compression method, applied in the direction of electrical components, code conversion, etc., can solve the problems of wind load frequency domain characteristics and correlation less attention, data compression deviation, error, etc., to simplify the time course and spectrum analysis process , easy to dig deep, efficient storage and application effects

Active Publication Date: 2017-01-11
黑龙江省工研院资产经营管理有限公司
View PDF3 Cites 9 Cited by
  • Summary
  • Abstract
  • Description
  • Claims
  • Application Information

AI Technical Summary

Problems solved by technology

[0003] The present invention is to solve the problem that less attention is paid to the frequency domain characteristics and correlation of wind load in the prior art, wh...

Method used


Image

  • Building wind tunnel pressure measurement test data compression method
  • Building wind tunnel pressure measurement test data compression method
  • Building wind tunnel pressure measurement test data compression method

Examples


specific Embodiment approach 1

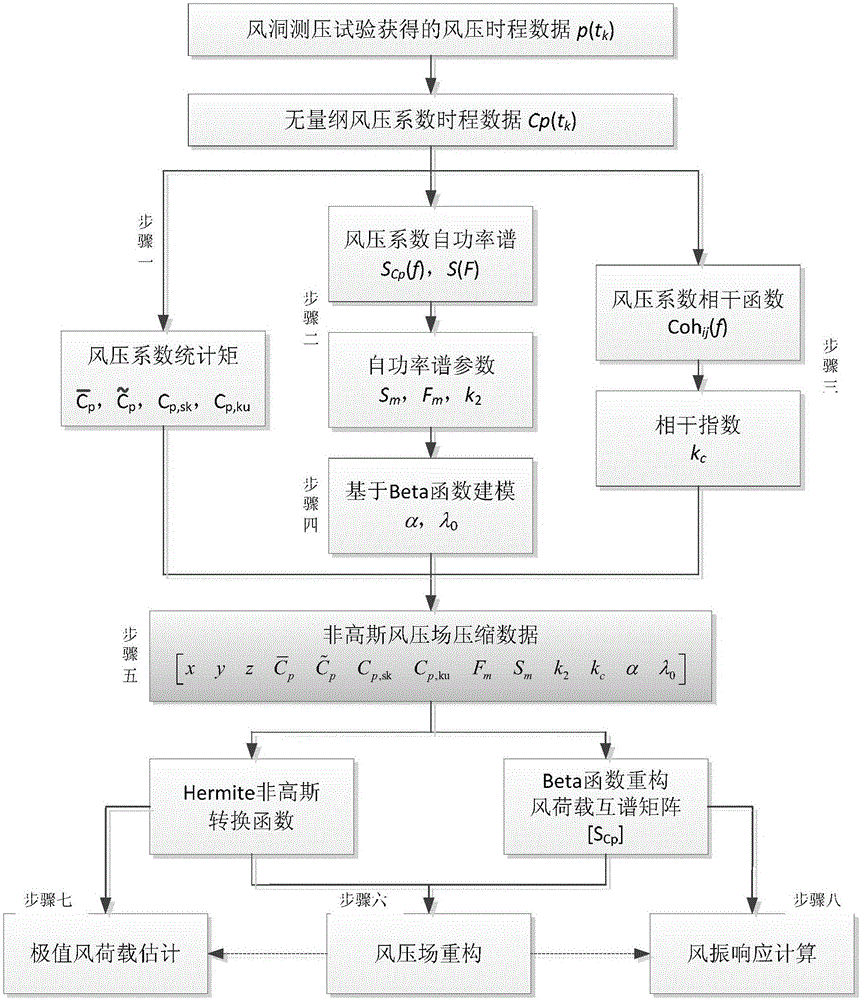
[0022] Specific implementation mode one: as figure 1 As shown, a method for compressing building wind tunnel pressure test data includes the following steps:

[0023] Step 1: Dimensionally convert the wind pressure time series data obtained from building wind tunnel test pressure measurement into wind pressure coefficient time history data, and calculate the unbiased estimated average value, root mean square value, skewness value and sum of wind pressure coefficient kurtosis value;

[0024] Step 2: Estimate the self-power spectrum for the time history of the wind pressure coefficient to obtain the self-power spectrum, and calculate the peak value of the dimensionless power spectrum curve and the slope of the high-frequency band of the curve in log-logarithmic coordinates;

[0025] Step 3: Estimate the coherence function of the wind pressure coefficient field by Welch method, and fit the coherence function with exponential function;

[0026] Step 4: Solve the equation with th...

specific Embodiment approach 2

[0031] Specific embodiment 2: The difference between this embodiment and specific embodiment 1 is that in the step 1, the wind pressure time series data obtained by building wind tunnel test pressure measurement is dimensionless into wind pressure coefficient time history data, and the wind pressure is calculated. The unbiased estimated mean, root mean square, skewness, and kurtosis values ​​of the coefficients are:

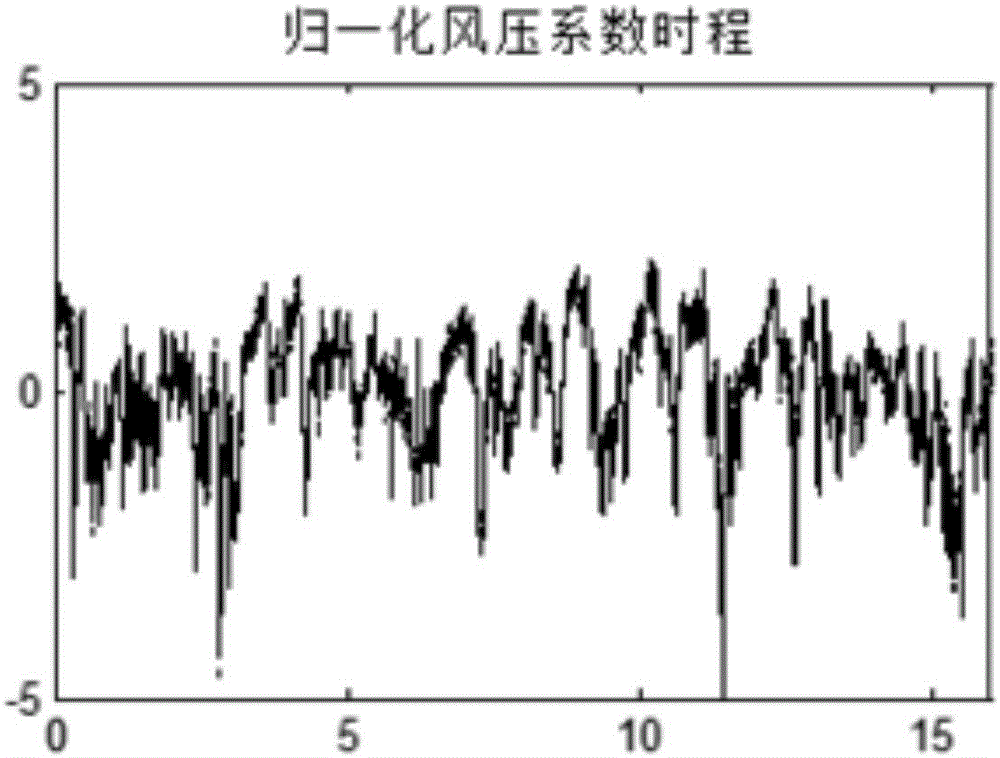
[0032] The wind pressure time series data p obtained from building wind tunnel test pressure measurement i (t k ), dimensionless into time-history data of wind pressure coefficient Wherein said i represents the measuring point number, t is the time, k represents the time series number, and the value is 1, 2, ..., N, N is the sampling length, ρ is the air density, and U represents the incoming wind speed at the reference height; and Compute unbiased estimated mean of wind pressure coefficient RMS Skewness value and kurtosis value

[0033] C...

specific Embodiment approach 3

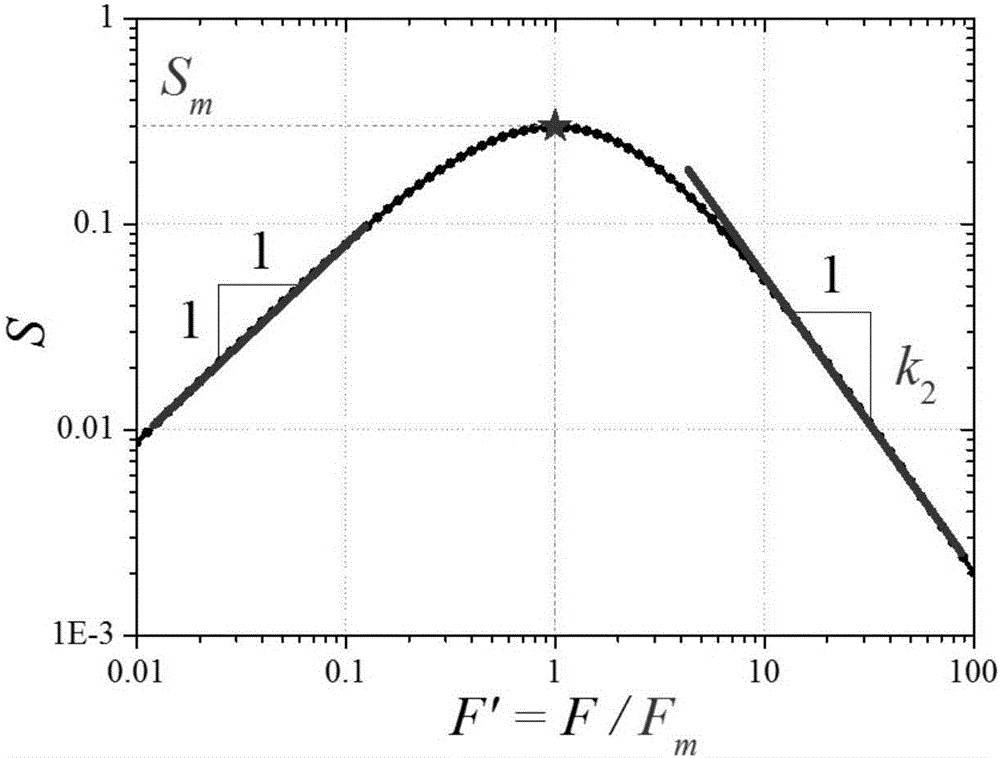
[0035] Specific embodiment three: the difference between this embodiment and specific embodiment one or two is that in the step two, the wind pressure coefficient time history is estimated from the power spectrum to obtain the self-power spectrum, and the peak value and curve of the dimensionless power spectrum curve are calculated. The slope of the high frequency band under the logarithmic coordinates is specifically:

[0036] Using the autoregressive AR model to estimate the autopower spectrum for the time history of the wind pressure coefficient, the autopower spectrum S is obtained Cp (f), which is dimensionless, expressed as The frequency f is dimensionless as Where L represents the reference scale; calculate the peak value of the dimensionless power spectrum curve S-F curve, that is, S m =max{S(F)},F m =argmax{S(F)}; and the slope of the high frequency section of the curve in log-log coordinates

[0037] k 2 = ( ...


PUM


Abstract

The invention relates to a building wind tunnel pressure measurement test data compression method. The invention aims at solving the problem that the little attention is paid to frequency domain characteristics of wind load and correlation in the prior art, resulting in a data compression error and an actual application error. The statistical information of the data is reconstructed by the Hermite polynomial, and the spectrum information is reconstructed by the Beta function theory, and a compressed wind pressure filed can be reconstructed at last in combination with random simulation technology. By adoption of the building wind tunnel pressure measurement test data compression method provided by the invention, the building wind tunnel pressure measurement data of GB and TB levels can be compressed to the KB and MB levels, and a novel information extracting and modeling method is provided for the high-dimension time-course large data of the wind load changing with time and space so as to achieve the data compression purpose at last. The building wind tunnel pressure measurement test data compression method is applied to the field of building wind tunnel pressure measurement tests.

Description

technical field [0001] The invention relates to a compression method for building wind tunnel pressure measurement test data. Background technique [0002] Wind tunnel pressure testing is one of the key steps in the wind resistance design of large and complex engineering structures. The time-history data of fluctuating wind load obtained from wind tunnel pressure test is large, reaching GB or even TB level, and contains rich information. The large amount of data leads to difficulties in data storage and analysis. Therefore, it is necessary to extract the characteristics of the data and compress the storage to facilitate data accumulation, analysis and prediction. The characteristics of wind load time history data obtained from building wind tunnel tests can be attributed to non-Gaussian partially correlated scalar fields. The current wind tunnel test data compression mostly uses the eigenvector method, focusing on the principal coordinate information of the wind load field...

Claims


Application Information

Patent Timeline
IPC IPC(8): H03M7/30
CPCH03M7/30
Inventor 苏宁孙瑛武岳沈世钊
Owner 黑龙江省工研院资产经营管理有限公司
Why Eureka
Try Eureka