A data compression method for building wind tunnel pressure measurement test
A technology of test data and compression method, applied in the direction of code conversion, electrical components, etc., can solve the problems of data compression deviation, error, wind load frequency domain characteristics and less attention to correlation, etc., to facilitate in-depth mining, efficient storage and Application, Simplification of Time History and Effects of Spectrum Analysis Process
- Summary
- Abstract
- Description
- Claims
- Application Information
AI Technical Summary
Problems solved by technology
Method used
Image
Examples
specific Embodiment approach 1
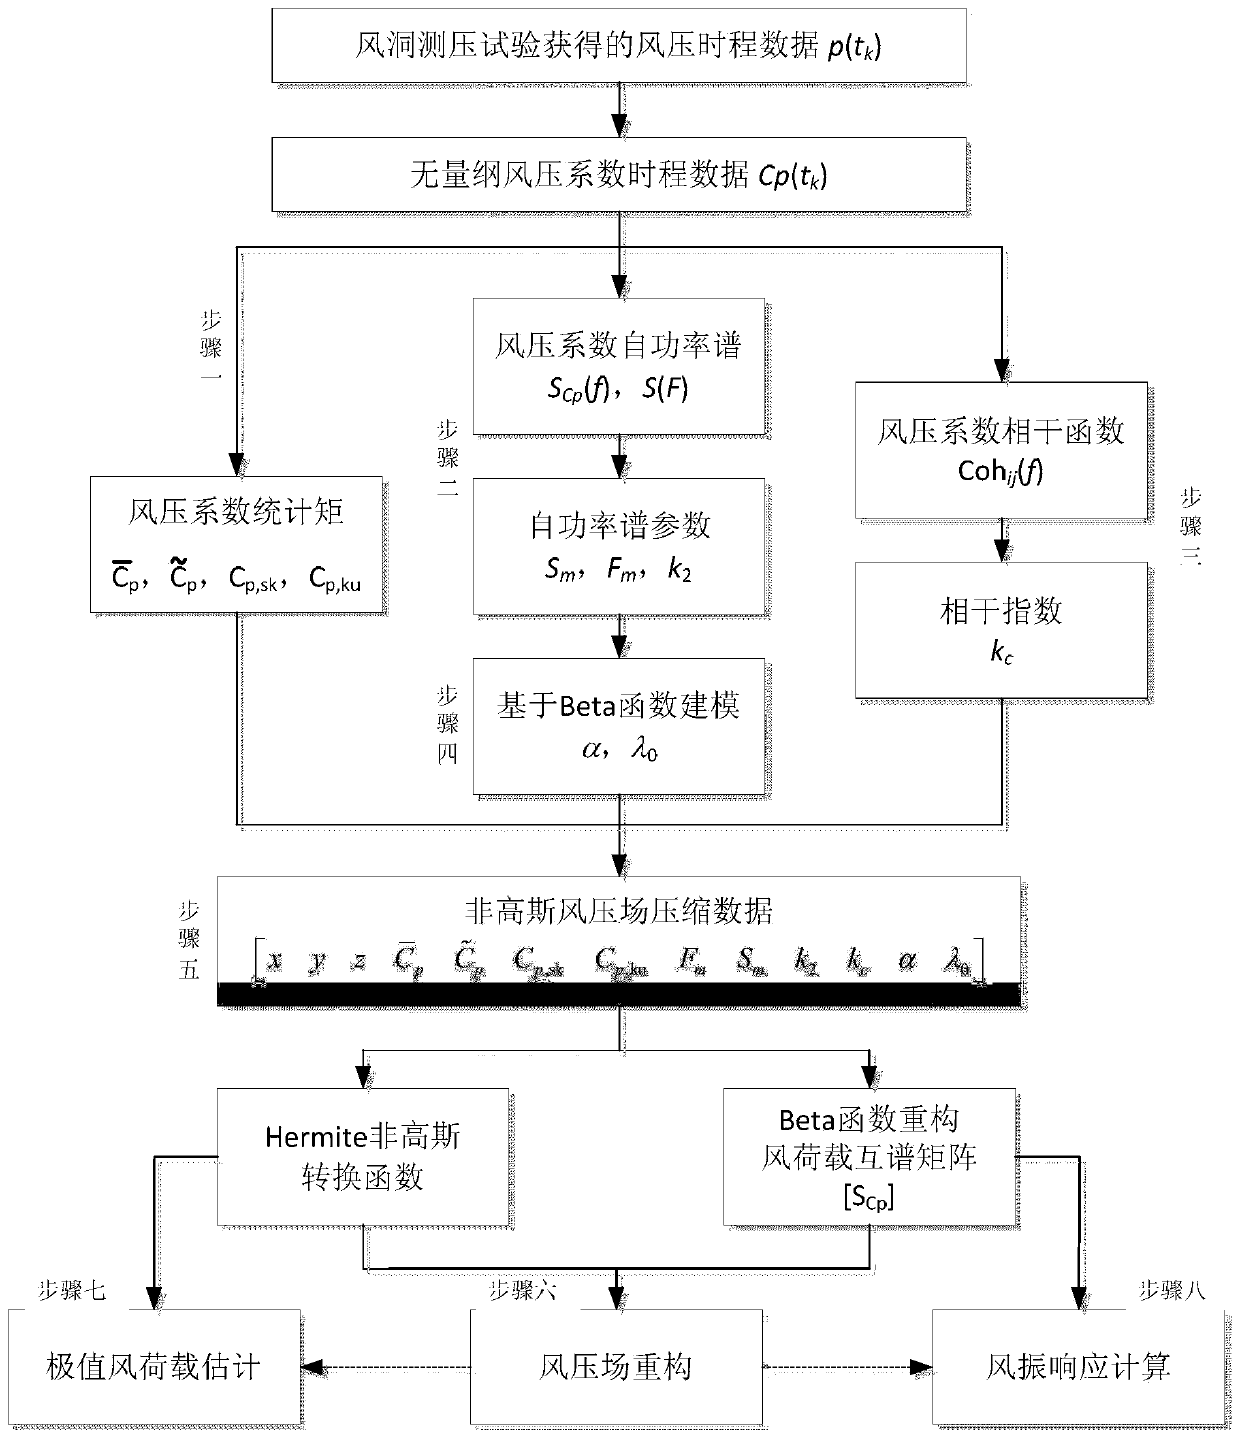
[0022] Specific implementation mode one: as figure 1 As shown, a method for compressing building wind tunnel pressure test data includes the following steps:
[0023] Step 1: Dimensionally convert the wind pressure time series data obtained from building wind tunnel test pressure measurement into wind pressure coefficient time history data, and calculate the unbiased estimated average value, root mean square value, skewness value and sum of wind pressure coefficient kurtosis value;
[0024] Step 2: Estimate the self-power spectrum for the time history of the wind pressure coefficient to obtain the self-power spectrum, and calculate the peak value of the dimensionless power spectrum curve and the slope of the high-frequency band of the curve in log-logarithmic coordinates;
[0025] Step 3: Estimate the coherence function of the wind pressure coefficient field by Welch method, and fit the coherence function with exponential function;
[0026] Step 4: Solve the equation with th...
specific Embodiment approach 2
[0031] Specific embodiment 2: The difference between this embodiment and specific embodiment 1 is that in the step 1, the wind pressure time series data obtained by building wind tunnel test pressure measurement is dimensionless into wind pressure coefficient time history data, and the wind pressure is calculated. The unbiased estimated mean, root mean square, skewness, and kurtosis values of the coefficients are:
[0032] The wind pressure time series data p obtained from building wind tunnel test pressure measurement i (t k ), dimensionless into time-history data of wind pressure coefficient Wherein said i represents the measuring point number, t is the time, k represents the time series number, and the value is 1, 2, ..., N, N is the sampling length, ρ is the air density, and U represents the incoming wind speed at the reference height; and Compute unbiased estimated mean of wind pressure coefficient RMS Skewness value and kurtosis value
[0033]
[0034] Oth...
specific Embodiment approach 3
[0035] Specific embodiment three: the difference between this embodiment and specific embodiment one or two is that in the step two, the wind pressure coefficient time history is estimated from the power spectrum to obtain the self-power spectrum, and the peak value and curve of the dimensionless power spectrum curve are calculated. The slope of the high frequency band under the logarithmic coordinates is specifically:
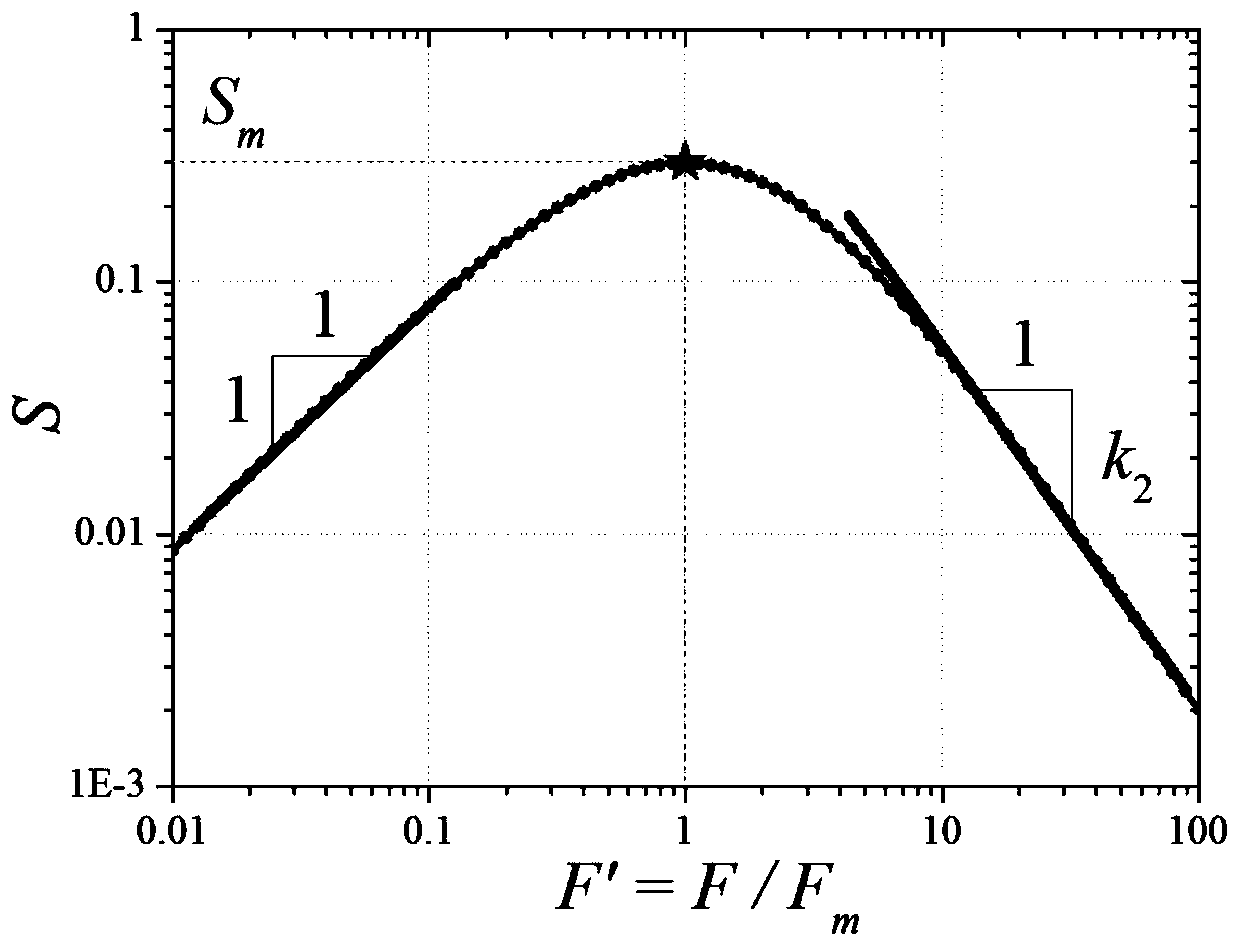
[0036] Using the autoregressive AR model to estimate the autopower spectrum for the time history of the wind pressure coefficient, the autopower spectrum S is obtained Cp (f), which is dimensionless, expressed as The frequency f is dimensionless as Where L represents the reference scale; calculate the peak value of the dimensionless power spectrum curve S-F curve, that is, S m =max{S(F)},F m =argmax{S(F)}; and the slope of the high frequency section of the curve in log-log coordinates
[0037]
[0038] In the formula, K is the half Fourier transform l...
PUM
 Abstract
Description
Claims
Application Information
 - R&D
- Intellectual Property
- Life Sciences
- Materials
- Tech Scout
- Unparalleled Data Quality
- Higher Quality Content
- 60% Fewer Hallucinations
Browse by: Latest US Patents, China's latest patents, Technical Efficacy Thesaurus, Application Domain, Technology Topic, Popular Technical Reports.
© 2025 PatSnap. All rights reserved.Legal|Privacy policy|Modern Slavery Act Transparency Statement|Sitemap|About US| Contact US: help@patsnap.com


