Router test data visualization method and system

A test data and router technology, applied in digital transmission systems, transmission systems, data exchange networks, etc., can solve the problems of difficult to observe data in a short time, high similarity of router test data, poor readability, etc., to achieve easy Enhanced readability, improved test efficiency, and the effect of a small amount of acquisition

Active Publication Date: 2017-04-26
王蕴卓
View PDF13 Cites 9 Cited by
  • Summary
  • Abstract
  • Description
  • Claims
  • Application Information

AI Technical Summary

Problems solved by technology

[0003] The present invention provides a method and system for data visualization, which is used to solve the problem that in the prior art, the test data of routers has a high similarity and poor readability due to the large amount of test data

Method used


Image

  • Router test data visualization method and system
  • Router test data visualization method and system
  • Router test data visualization method and system

Examples


Embodiment Construction

[0065] In order to make the object, technical solution and advantages of the present invention clearer, the present invention will be further described in detail below in conjunction with the accompanying drawings. Obviously, the described embodiments are only some embodiments of the present invention, rather than all embodiments . Based on the embodiments of the present invention, all other embodiments obtained by persons of ordinary skill in the art without making creative efforts belong to the protection scope of the present invention.

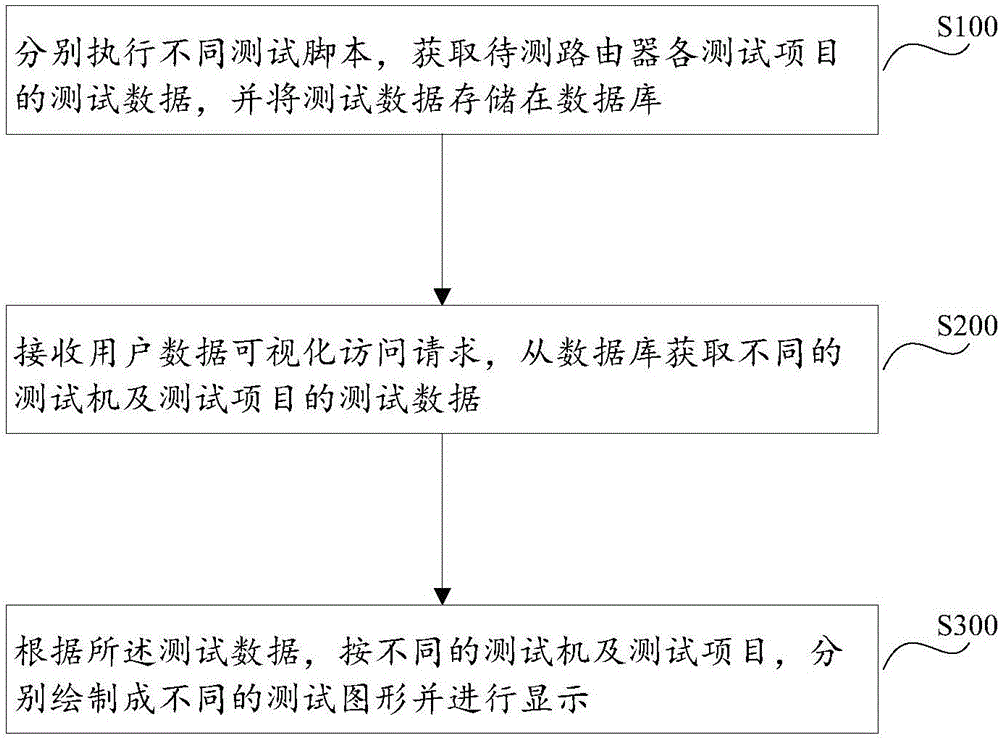
[0066] A method for visualizing router test data in the present invention, the embodiment is as follows figure 1 As shown, including the steps:

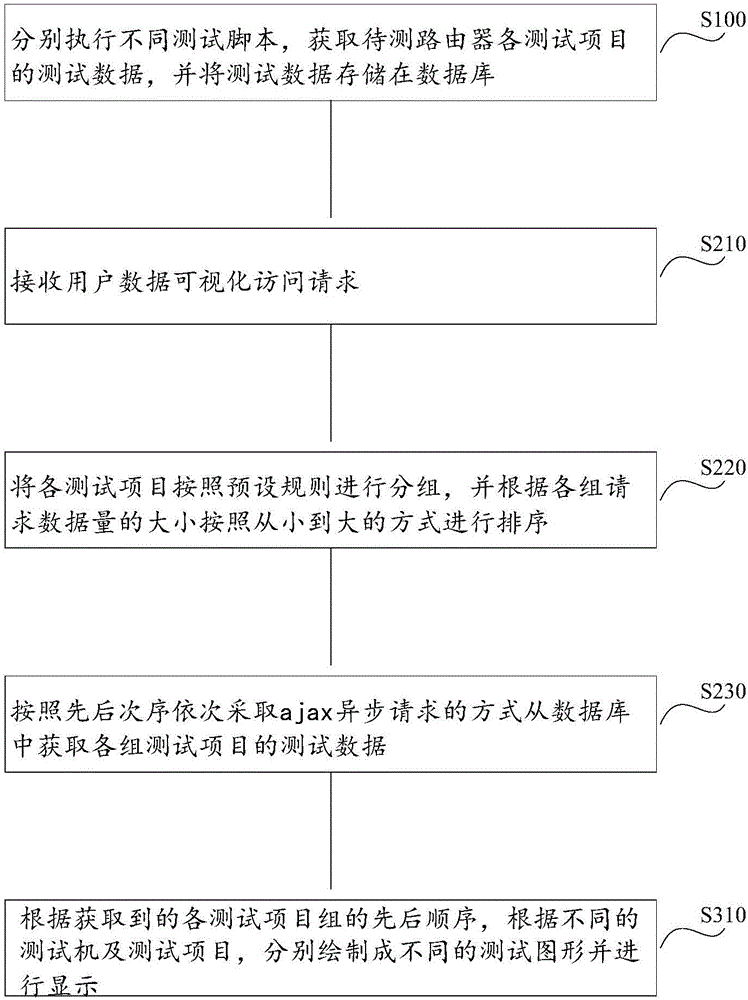
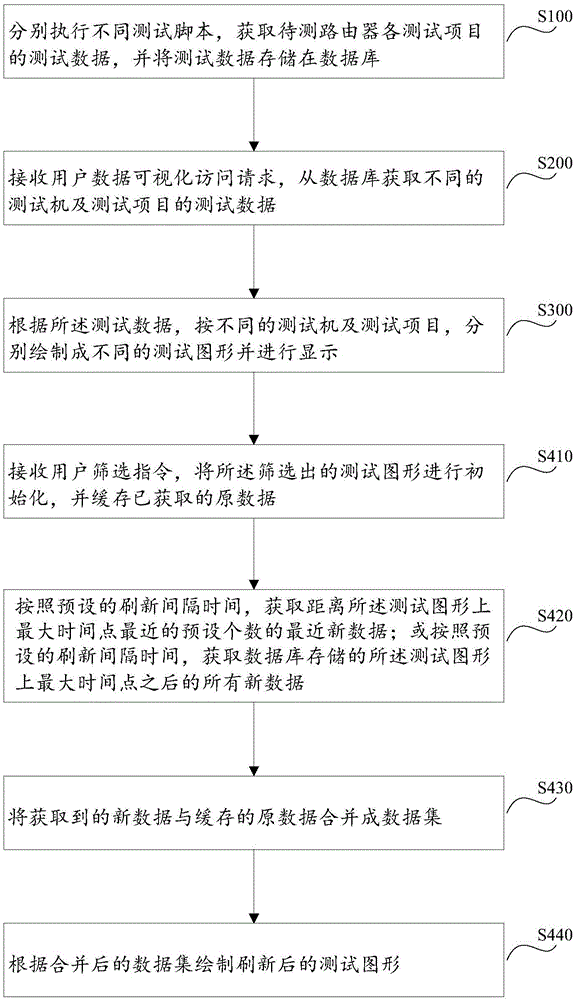
[0067] S100 executes different test scripts respectively, obtains test data of each test item of the router to be tested, and stores the test data in a database;

[0068] S200 receives user data visualization access requests, and obtains test data of different test machines and test items from t...


PUM


Abstract

The invention discloses a router test data visualization method, and the method comprises the following steps: respectively executing different testing scripts, obtaining the test data of all test projects of a to-be-tested router, and storing the test data in a database; receiving a data visualization access data of a user, and obtaining the test data of different testers and test projects from the database; respectively drawing different test graphs according to the test data and different testers and test projects, and displaying the test graphs. The invention also discloses a router test data visualization system, and the system comprises at least two testers, a storage module, a management module, and a drawing module. The storage module is connected with the testers, and the management module is connected with the storage module and the drawing module. From the aspect of testing and monitoring of the router, the method and system elaborate the specific implementation and detailed functions, achieve the visualization of test data, and improve the testing efficiency.

Description

technical field [0001] The invention relates to test data processing, in particular to a method and system for visualizing router test data. Background technique [0002] In the wireless router test phase, it is necessary to monitor multiple performance indicators continuously for a long time, such as the remaining memory of the device, the running time of the device, the remaining CPU of the device and other parameters. A large amount of data will be generated in the testing phase, and the data is huge in quantity, highly similar, and poor in readability. It is difficult to observe the characteristics of the data or find problems in a short period of time. The prior art only provides a method for testing the stability of the wireless router, but does not further effectively manage the data generated by the test, and the readability of the test data is poor. Contents of the invention [0003] The present invention provides a data visualization method and system to solve t...

Claims


Application Information

Patent Timeline
IPC IPC(8): H04W24/04H04L12/26
CPCH04L43/045H04W24/04
Inventor 韩仁彬
Owner 王蕴卓
Why Eureka
Try Eureka