
Blower fan abnormal data processing method and device based on quartile box plot

A technology of abnormal data and quartile method, which is applied in the field of wind power, can solve problems such as data rigidity, data analysis influence, and adverse effects of results, and achieve objective results

Inactive Publication Date: 2017-06-27
国能日新科技股份有限公司
View PDF4 Cites 26 Cited by
  • Summary
  • Abstract
  • Description
  • Claims
  • Application Information

AI Technical Summary

Problems solved by technology

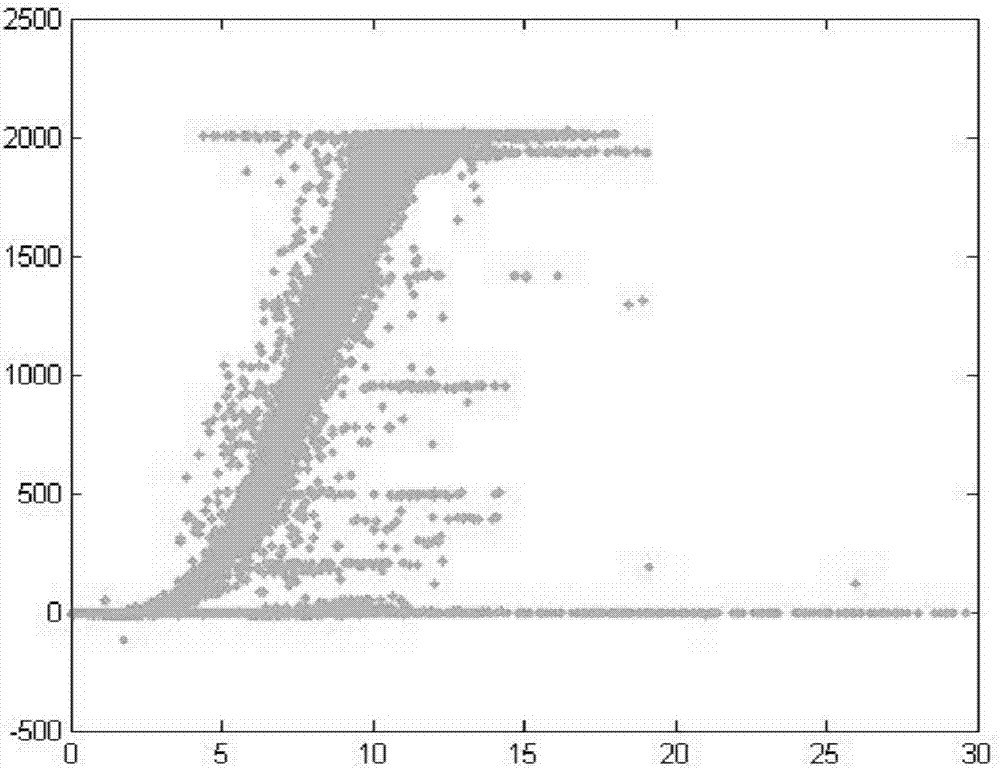
[0005] (1) The fitted curve cannot fully represent the distribution law of the fan data, and there is a certain deviation in the fitting, which will mislead the subsequent further processing;
[0006] (2) The artificially established upper and lower limits are only based on historical experience and lack a certain scientific basis; they often result in incorrect processing of correct data and missing processing of abnormal data. The processed data is relatively blunt, and human factors are added to the data , have a certain impact on subsequent data analysis
[0007] (3) The standard of statistical fitting to judge outliers is based on the mean and standard deviation of the calculated data, and the resistance of the mean and standard deviation is extremely small, and the outliers themselves will have a greater impact on them, so the resulting The number of outliers will not exceed 0.7% of the total; using this method to judge outliers in non-normally distributed data has limited effectiveness
[0008] In the processing of a large number of wind turbine data, outliers are worthy of attention. It is very dangerous to ignore the existence of outliers. In the process of calculating and analyzing data, if the processing of outliers is not considered, it will have a negative impact on the results. ;Pay attention to the emergence of outliers and analyze the causes of them, which often become an opportunity to find problems and improve decision-making

Method used


Image

  • Blower fan abnormal data processing method and device based on quartile box plot
  • Blower fan abnormal data processing method and device based on quartile box plot
  • Blower fan abnormal data processing method and device based on quartile box plot

Examples


Embodiment Construction

[0060] It should be noted that, in the case of no conflict, the embodiments of the present invention and the features in the embodiments can be combined with each other.

[0061] Firstly, the technical terms and technical data involved in the present invention are explained:

[0062] 1. Quartiles

[0063] Quartile (Quartile), that is, in statistics, arrange all the values ​​​​from small to large and divide them into four equal parts. The value at the three division points is the quartile.

[0064] The first quartile (Q1), also known as the "smaller quartile" or "lower quartile", is equal to the 25th percentile of all values ​​in the sample arranged from small to large.

[0065] The second quartile (Q2), also known as the "median", is equal to the 50th percentile of all values ​​in the sample arranged from small to large.

[0066] The third quartile (Q3), also known as the "larger quartile" or "upper quartile", is equal to the 75th percentile of all values ​​in the sample arr...


PUM


Abstract

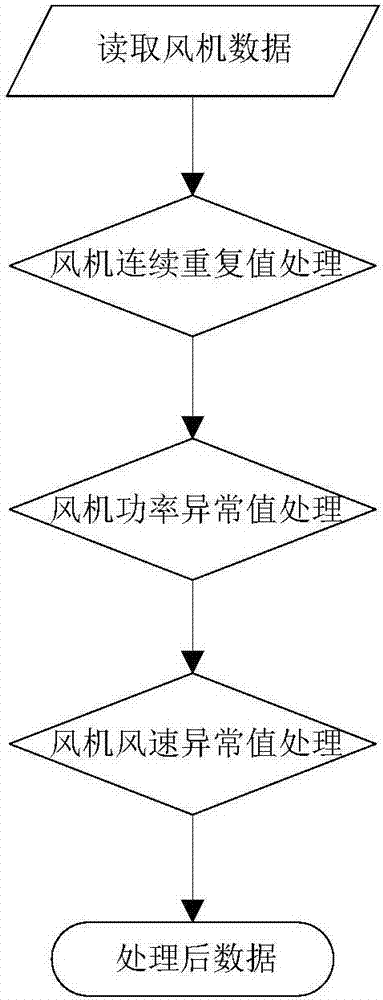
The invention provides a blower fan abnormal data processing method and device based on a quartile box plot. The method comprises steps that (1), blower fan data is read according to a certain format; (2), continuous repeated values of the blower fan data are eliminated; (3), blower fan power abnormal values are determined and processed through utilizing a quartile method; and (4), blower fan wind speed abnormal values are determined and processed through utilizing the quartile method. The method is advantaged in that different form a classic abnormal value identification method, drawing of the box plot is based on actual data, assuming data to be in a specific distribution form in advance is not needed, not any restrictive requirements are made for the data, original appearance of the data shape is simply, truly and visually presented, on the other hand, abnormal value determination standards of the box plot are based on a quartile number and a quartile range, the quartile number has certain resistance effects, up to 25% data can be any far on the condition that the quartile number is not greatly disturbed, so abnormal values have no influence on the standards, and thereby an abnormal value identification result through the box plot is relatively objective.

Description

technical field [0001] The invention belongs to the field of wind power, and in particular relates to a method and device for processing abnormal data of a fan based on a quartile box plot. Background technique [0002] With the rapid development of new energy, the wind power grid-connected capacity is increasing rapidly. In the processing of wind farm operation data, the processing of wind turbine output data is particularly important. However, for a long time, most of the data processing has been processed by manual experience. , the lack of a systematic data processing method based on statistics. [0003] The existing data processing method for fans is to fit a statistical fitting curve based on the wind speed of the fan head and the output of the fan. On the basis of this curve, an upper and lower confidence interval is artificially established according to experience, and data processing is performed according to this interval. [0004] Existing methods have the follow...

Claims


Application Information

Patent Timeline
IPC IPC(8): G06Q50/06
Inventor 向婕雍正王德民
Owner 国能日新科技股份有限公司
Learn More