Biomarkers for Obesity-Related Diseases
A biomarker, obesity technology, applied in the field of prediction of diseases related to microorganisms, can solve problems such as low sensitivity
- Summary
- Abstract
- Description
- Claims
- Application Information
AI Technical Summary
Problems solved by technology
Method used
Image

Examples
example 1
[0062] Example 1. Identification of biomarkers for assessing obesity risk
[0063] 1.1 Sample collection
[0064] Fecal samples from 158 Chinese subjects (including 78 obese patients and 80 control subjects (training set)) were collected by Ruijin Hospital, Shanghai Jiaotong University School of Medicine in 2012. Obese patients ranged in age from 18 to 30 years and had a BMI above 25. Subjects were asked to collect fresh stool samples at the hospital. Collected samples were placed in sterile tubes and immediately stored at -80 °C until further analysis.
[0065] Full ethical approval was obtained and all patients gave written informed consent. This study was approved by the Ethical Review Board of Ruijin Hospital, Shanghai Jiaotong University School of Medicine.
[0066] 1.2 DNA extraction
[0067] Fecal samples were thawed on ice and DNA extraction was performed using the Qiagen QIAamp DNA Stool Mini kit (Qiagen) according to the manufacturer's instructions. Extracts ...
example 2
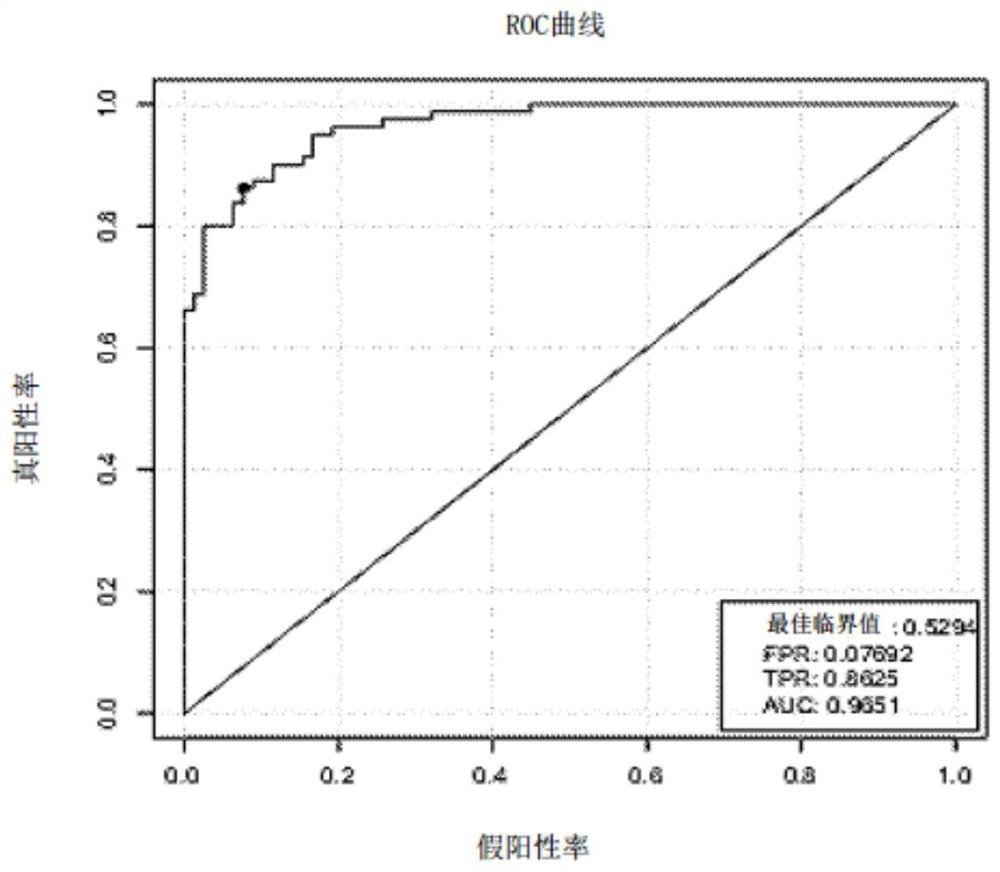
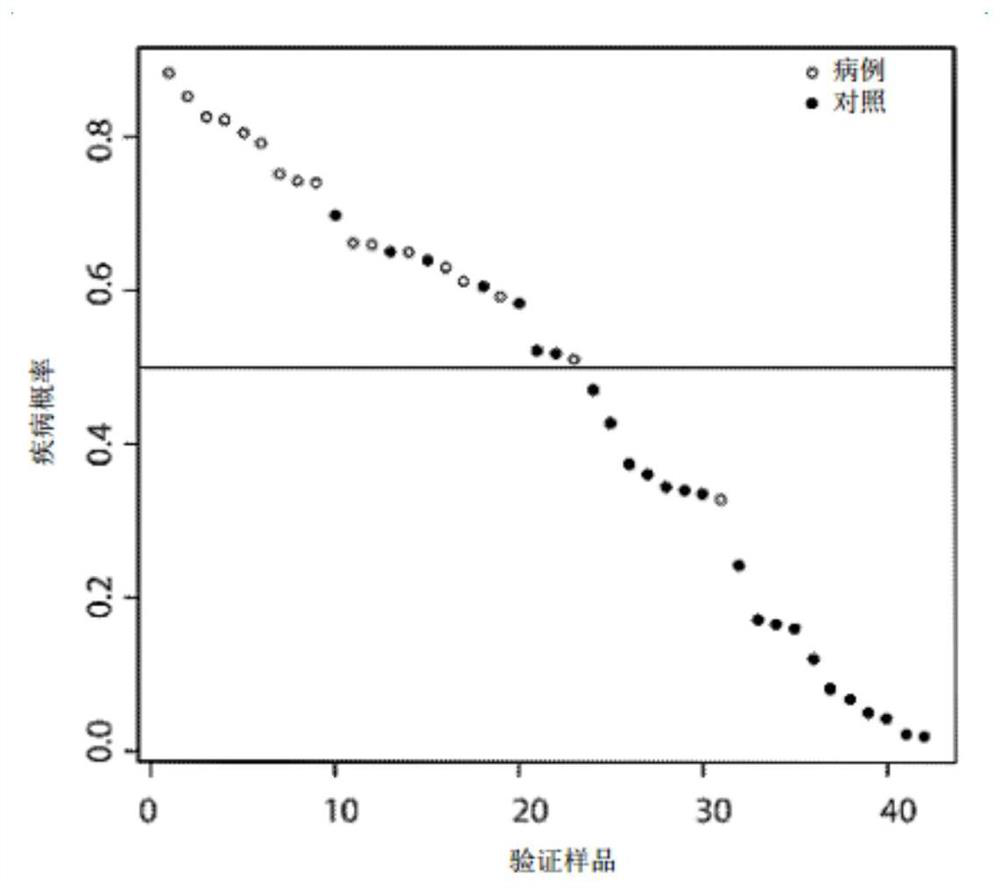
[0122] Example 2. Validation of 54 biomarkers in 42 samples (test set)
[0123] The present inventors used another new independent research group (including 17 obese patients and 25 non-obese controls collected in Ruijin Hospital, Shanghai Jiao Tong University School of Medicine) to verify the discriminative ability of the obesity classifier.
[0124] DNA from each sample was extracted and a DNA library was constructed, followed by high-throughput sequencing as described in Example 1. The present inventors calculated the gene abundance profiles of these samples using the same method as described in Qin et al., 2012, supra. The gene relative abundance for each marker as shown in SEQ ID NO: 1-48497 was then determined. The present inventors estimated the relative abundance of MLG in all samples by using the relative abundance values of genes from this MLG (Qin et al., 2012, supra).
[0125] To validate the 54 MLG markers, the inventors used random forests to set up the mod...
example 3
[0130] Example 3. Validation of 54 gene biomarkers in 22 samples (test set)
[0131] The inventors verified the discriminative ability of the obesity classifier using another test set sample (Table 7), which included 9 case samples and 13 control samples (5 samples 1 month after surgery and 3 months after surgery). 8 samples), samples were also collected in Ruijin Hospital, Shanghai Jiao Tong University School of Medicine. Cases represent samples before surgery and controls represent 1 and 3 months after surgery.
[0132] Table 7 Information of 22 samples
[0133]
[0134]
[0135] *Before: before surgery; 1-M: one month after surgery; 3-M: three months after surgery.
[0136] DNA from each sample was extracted and a DNA library was constructed, followed by high-throughput sequencing as described in Example 1. The present inventors calculated the gene abundance profiles of these samples using the same method as described in Qin et al., 2012, supra. The gene relativ...
PUM
 Abstract
Description
Claims
Application Information