
Multi-parameter optimized drawing method and system for annual regulation reservoir power generation scheduling graphs

A technology for regulating reservoirs and dispatching diagrams. It is applied in data processing applications, forecasting, instruments, etc. It can solve the problem that the mapping process of power generation dispatching diagrams and the graphics themselves are complex, cannot fully reflect the laws of dispatching operation, and do not have traditional dispatching diagrams. Easy to use Sex and other issues, to achieve the effect of simple and easy-to-use drawing

Active Publication Date: 2018-01-19
HUAZHONG UNIV OF SCI & TECH
View PDF7 Cites 12 Cited by
  • Summary
  • Abstract
  • Description
  • Claims
  • Application Information

AI Technical Summary

Problems solved by technology

[0005] Aiming at the defects of the prior art, the object of the present invention is that the existing method for drawing reservoir dispatching diagrams cannot fully consider the factors affecting the corresponding output of the output area of ​​the dispatching diagram, the input runoff used in the drawing process, etc., and the obtained results cannot fully reflect the law of dispatching operation , and considering the joint dispatching of cascade reservoirs, the generation dispatching diagram is relatively complicated in the drawing process and the graph itself, and does not have the technical problem of the ease of use of the traditional dispatching diagram

Method used


Image

  • Multi-parameter optimized drawing method and system for annual regulation reservoir power generation scheduling graphs
  • Multi-parameter optimized drawing method and system for annual regulation reservoir power generation scheduling graphs
  • Multi-parameter optimized drawing method and system for annual regulation reservoir power generation scheduling graphs

Examples


Embodiment Construction

[0069] In order to make the object, technical solution and advantages of the present invention clearer, the present invention will be further described in detail below in conjunction with the accompanying drawings and embodiments. It should be understood that the specific embodiments described here are only used to explain the present invention, not to limit the present invention.

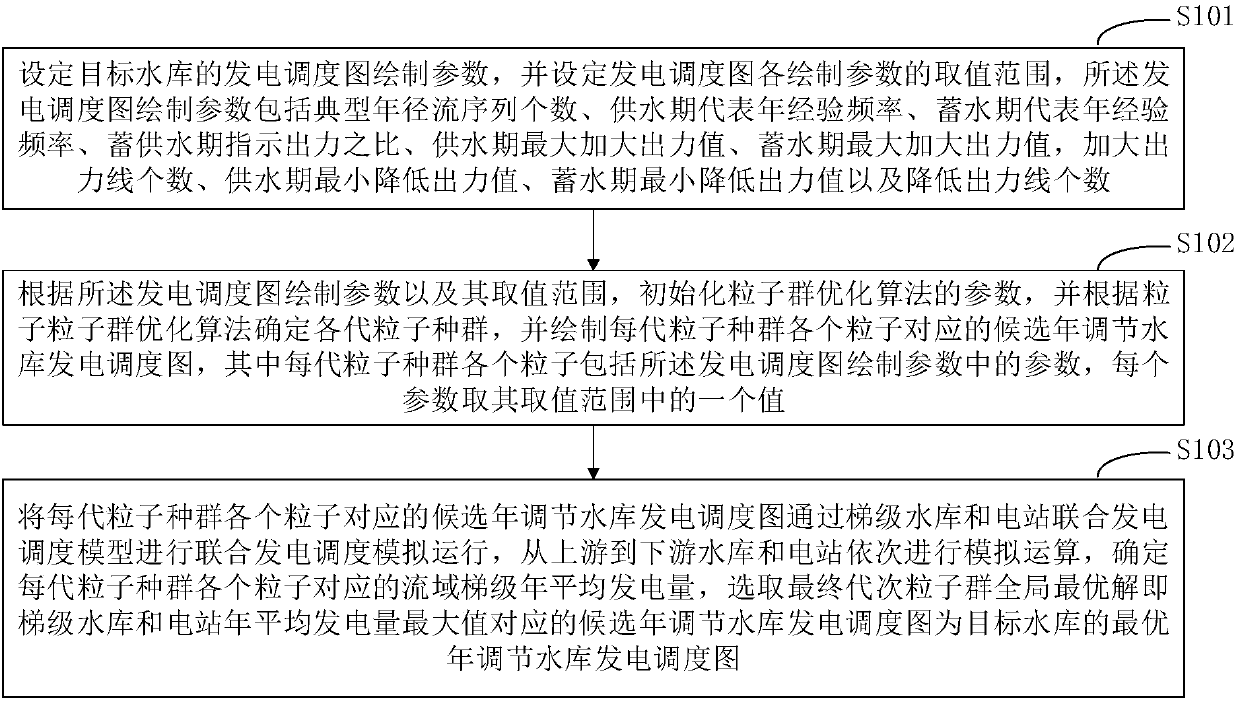
[0070] figure 2 It is a schematic flowchart of a multi-parameter optimal drawing method for an annual regulation reservoir power generation scheduling diagram provided by an embodiment of the present invention; it includes steps S101 to S103.

[0071] S101, setting the drawing parameters of the power generation dispatching map of the target reservoir, and setting the value range of each drawing parameter of the generating dispatching map, the drawing parameters of the power generation dispatching map include the number of typical annual runoff sequences, the representative annual frequency of the ...


PUM


Abstract

The invention discloses a multi-parameter optimized drawing method and system for annual regulation reservoir power generation scheduling graphs. The method comprises the following steps of: setting apower generation scheduling graph drawing parameter and setting a value range of the power generation scheduling graph drawing parameter; initializing a parameter of a particle swarm optimization algorithm and determining each generation of particle swarm according to the power generation scheduling graph drawing parameter and the value range, and drawing a candidate annual regulation reservoir power generation scheduling graph corresponding to each particle in each generation of particle swarm; carrying out combined power generation scheduling simulation run on the candidate annual regulation reservoir power generation scheduling graph corresponding to each particle in each generation of particle swarm through a cascade reservoir and a power station combined power generation scheduling model, and selecting a globally optimal solution of the final generation of particle swarm, namely, a candidate annual regulation reservoir power generation scheduling graph corresponding to a maximumannual mean power generation capacity of the cascade reservoir, as an optimum annual regulation reservoir power generation scheduling graph of a target reservoir. The method and system are capable ofcomprehensively reflecting the law of scheduling run and considering combined scheduling of cascade reservoirs so as to obtain simple and easy annual regulation reservoir power generation scheduling graphs.

Description

technical field [0001] The invention belongs to the technical field of power generation scheduling of hydropower stations, and more specifically relates to a multi-parameter optimal drawing method and system for an annual regulation reservoir power generation scheduling diagram. Background technique [0002] One of the important basis for hydropower station to carry out power generation scheduling is the power generation scheduling diagram. The scheduling diagram is a two-dimensional graph in the Cartesian coordinate system. The abscissa represents time, and the range is one year. Usually, the unit is month or ten days, and it can start from January of a natural year. , or according to the hydrological year, such as from the water storage period (such as June-October) to the water supply period (such as November-May), the vertical axis represents the water level of the upstream reservoir of the power station, which can contain several curves that do not cross each other . S...

Claims


Application Information

Patent Timeline
Patent Type & Authority Applications(China)
IPC IPC(8): G06Q10/04G06Q50/06G06N3/00
Inventor 周建中欧阳文宇谢蒙飞高新稳李远哲银星黎
Owner HUAZHONG UNIV OF SCI & TECH
Learn More