Display method of water ecology prediction results based on 3D grid visualization and dynamic playback

A dynamic playback and three-dimensional grid technology, which is applied in the fields of instruments, computing, and image data processing, can solve problems such as unintuitive display methods, damage to the integrity of water bodies, and impact on judgment and analysis.

Active Publication Date: 2021-05-28
SICHUANG TECH CO LTD
View PDF3 Cites 0 Cited by
  • Summary
  • Abstract
  • Description
  • Claims
  • Application Information

AI Technical Summary

Problems solved by technology

This display method is not intuitive, and it destroys the integrity of the water body display, and cannot allow users to grasp the overall situation of the water body, thus affecting judgment and analysis

Method used


Image

  • Display method of water ecology prediction results based on 3D grid visualization and dynamic playback
  • Display method of water ecology prediction results based on 3D grid visualization and dynamic playback
  • Display method of water ecology prediction results based on 3D grid visualization and dynamic playback

Examples


Embodiment Construction

[0027] The present invention will be further explained below in conjunction with the accompanying drawings and specific embodiments.

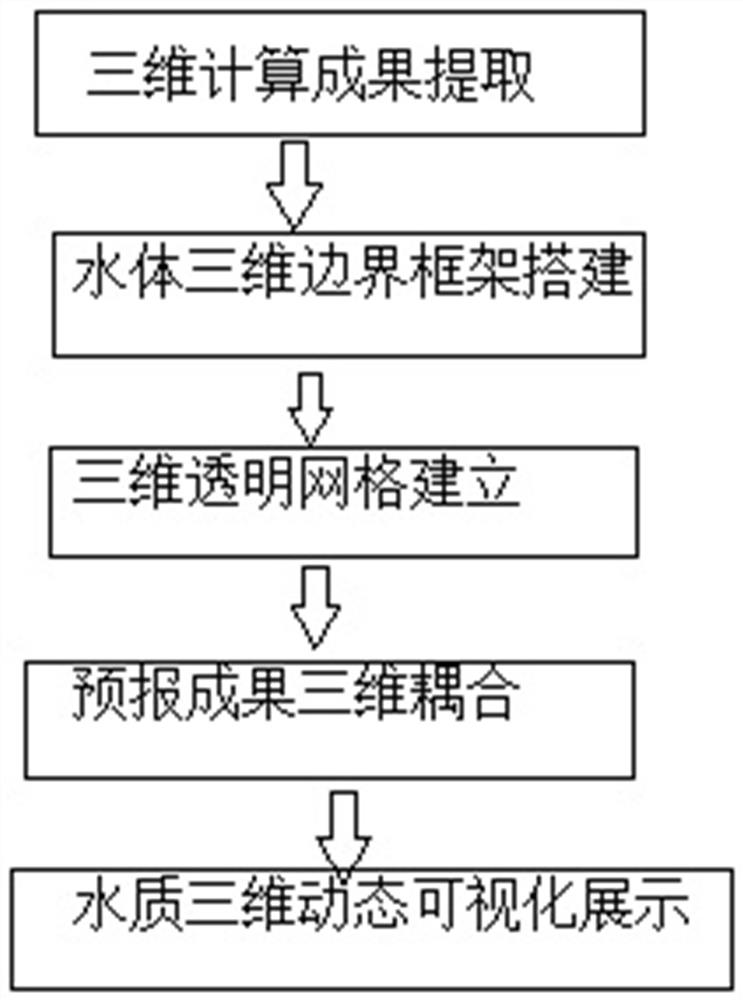
[0028] The invention aims to realize the dynamic display of water quality and ecology prediction results based on three-dimensional grid visualization, and provide users with a more complete and three-dimensional water quality trend change scene. The specific process diagram can be found in figure 1 .

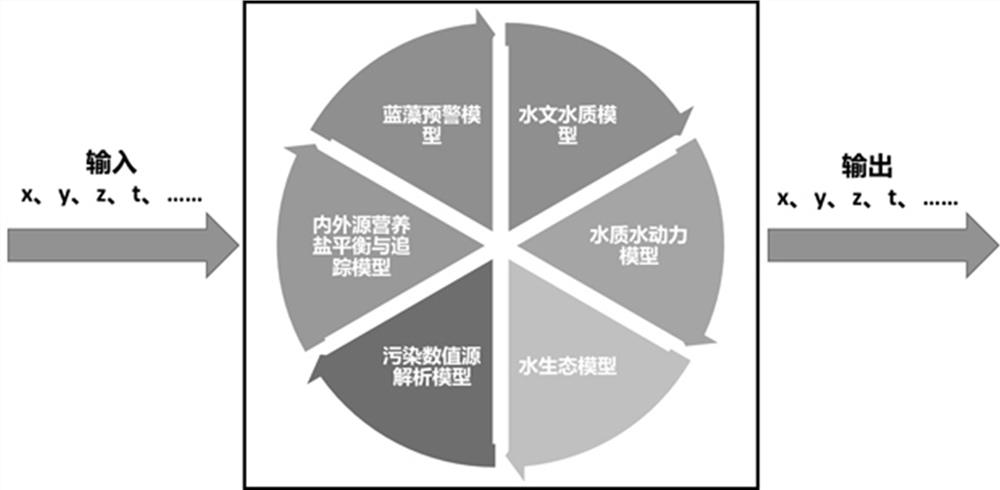
[0029] Step S1: Extraction of 3D calculation results: extract and refine the calculation results of water quality-related models according to the four dimensions of x, y, z, and t, and use them to match with the 3D scene. (Explanation of x, y, z, t involved in the scheme: x: longitude; y: latitude; z: depth; t: time)

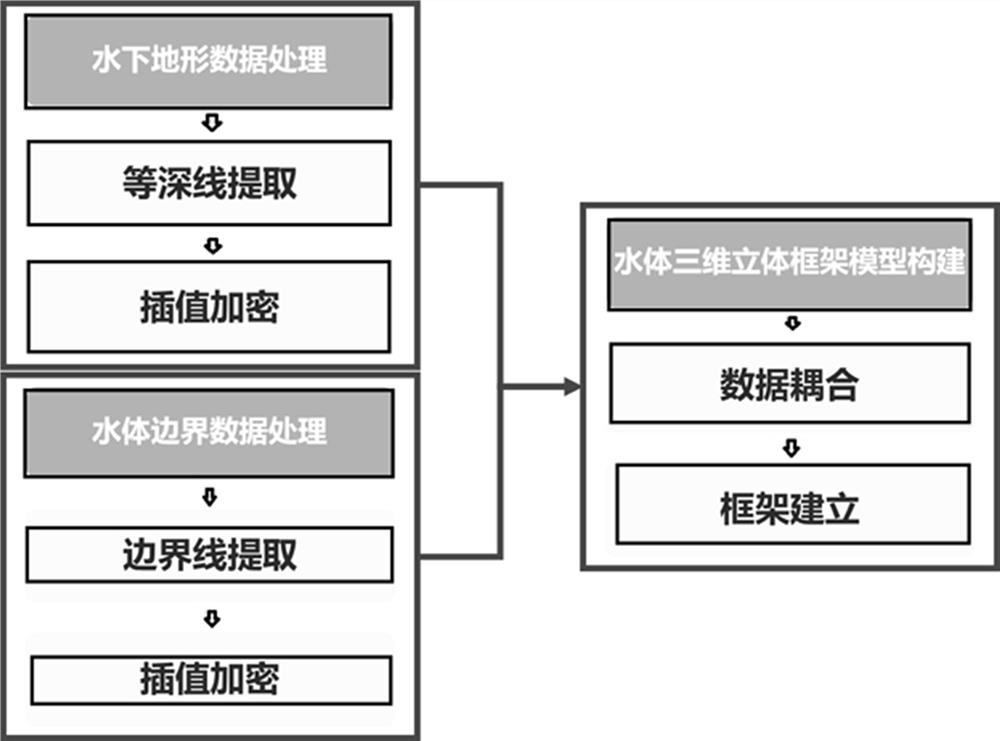
[0030] Step S2: Construction of the three-dimensional boundary frame of the water body: a three-dimensional water body boundary frame is established based on the underwater terrain data of the water body and the water body bound...


PUM


Abstract

The purpose of the present invention is to provide a method for displaying water ecology prediction results based on three-dimensional grid visualization and dynamic playback, which includes the following steps: Step S1: Extract the calculation results of water quality related models according to the four dimensions of x, y, z, and t Refining for matching with the 3D scene; Step S2: Establishing a 3D water body boundary frame based on the underwater topography data and water body boundary data; Step S3: Carrying out grid division and transparency for the water body based on the water body 3D boundary frame Processing to achieve unit water body standardization and water body perspective; Step S4: Coupling and integrating the extracted 3D calculation results with the transparent gridded water body 3D frame to achieve spatial and temporal matching, consistent with the color threshold standard; step S5: Based on the three-dimensional display of water quality prediction results, the results will be dynamically displayed as time goes by. The present invention provides users with a more complete and three-dimensional water quality trend change scene.

Description

technical field [0001] The invention belongs to the field of water ecological environment protection, and in particular relates to a method for displaying water ecological prediction results based on three-dimensional grid visualization and dynamic playback. Background technique [0002] In the field of water environment ecological protection, it is often necessary to predict future water quality changes based on water quality and water ecological models. On the basis of establishing the water quality and water ecology model, an intuitive and dynamic water quality and water ecology forecasting and forecasting results display method is required to provide users with vivid model results and facilitate decision-making analysis. The display of water body prediction and forecasting results for river channels is relatively simple, but it is difficult to display the prediction and forecasting results in a complete, comprehensive and vivid way when it comes to water quality predicti...

Claims


Application Information

Patent Timeline
Patent Type & Authority Patents(China)
IPC IPC(8): G06T17/20G06T19/20
CPCG06T17/20G06T19/20G06T2219/2012G06T2219/2016
Inventor 单森华陈宝珠张火炬江峰
Owner SICHUANG TECH CO LTD
Why Eureka
Try Eureka