
Fusion data-based resident trip OD distribution extraction method

An extraction method and data technology, applied in data processing applications, electrical digital data processing, special data processing applications, etc., can solve the problems of long data update cycle, small sample size, difficult application, etc., to overcome uneven sampling in surveys, Uniform travel distribution and improved accuracy

Active Publication Date: 2018-04-24
SHANGHAI URBAN CONSTR DESIGN RES INST GRP CO LTD
View PDF3 Cites 12 Cited by
  • Summary
  • Abstract
  • Description
  • Claims
  • Application Information

AI Technical Summary

Problems solved by technology

[0004] One is based on the traditional traffic survey data, which is an important part of the four-stage model; this method is based on regression analysis to count the survey data as traffic generation, and then distribute it to the traffic area with a mathematical model to convert the travel volume into traffic volume; This method can collect the socioeconomic attributes of travelers, and then predict the traffic demand of the planning area in the next few years, but its shortcomings are also obvious: heavy survey workload, time-consuming data collection and processing, low sampling uniformity, and large sample size. Small size, long data update cycle, difficult to grasp the dynamic changes of travel distribution
[0005] The other is to use the existing traffic detector to obtain the observed traffic volume of the road section, and calculate the OD matrix through the inverse process of traffic allocation; although this method skips the generation, distribution and division of traffic trips, it directly uses the traffic volume of the road section to estimate the OD matrix , but it is difficult to obtain the traffic volume of the entire road network section, and it is easy to underestimate the traffic volume. Compared with the traditional traffic survey method, the socioeconomic attributes of travelers cannot be obtained, and it is difficult to apply in future traffic planning.

Method used


Image

  • Fusion data-based resident trip OD distribution extraction method
  • Fusion data-based resident trip OD distribution extraction method
  • Fusion data-based resident trip OD distribution extraction method

Examples


Embodiment

[0052] The extraction method of residents' travel OD distribution based on fusion data; the steps are as follows:

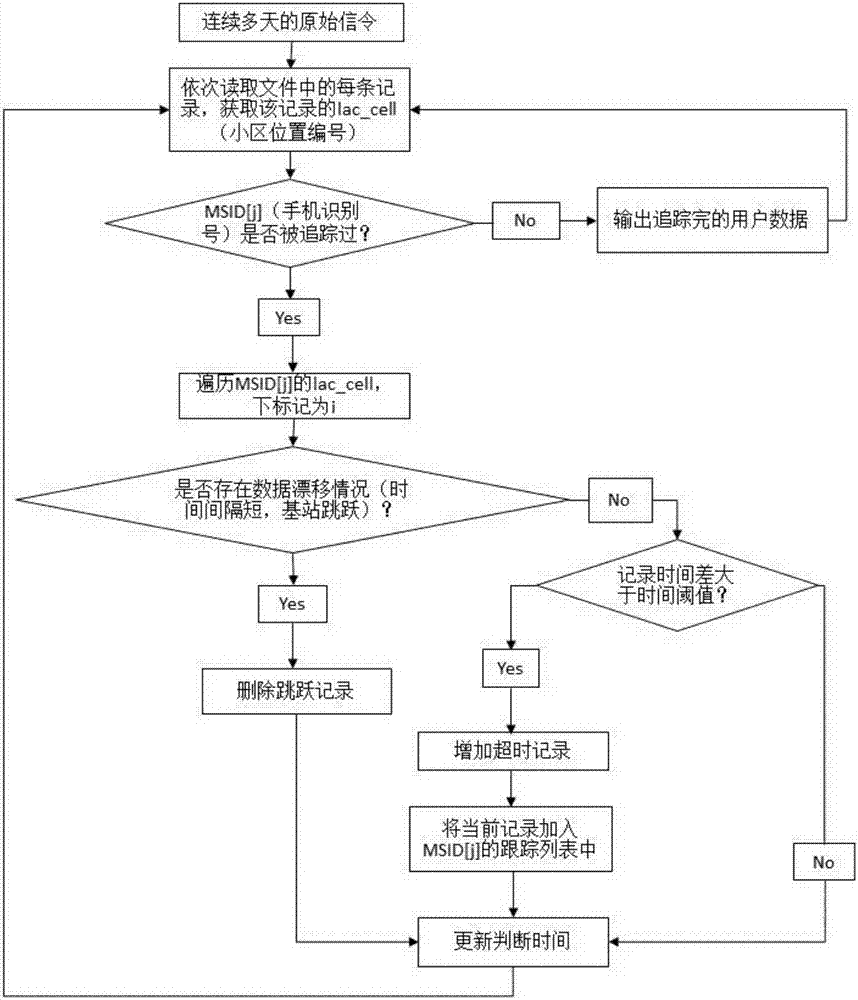
[0053] A. Clean and preprocess the original mobile phone signaling data, remove the error data and ping-pong switching data in the original mobile phone signaling data, and form the required mobile phone signaling data;

[0054] B. Process the questionnaire-style residents’ travel survey data to obtain residents’ travel characteristic parameters, which at least include travel rate, travel distance, and travel time;

[0055] C. Using the characteristic parameters of residents’ travel, calibrate and check the residence time threshold in the mobile phone signaling data, and obtain the initial OD distribution matrix of residents’ travel;

[0056] D. Through statistical methods, the mobile phone signaling data is reasonably expanded, and the expansion rate is determined according to the sampling percentage of the residents' travel survey. The expansion rate is the rec...


PUM


Abstract

The invention discloses a fusion data-based resident trip OD distribution extraction method, and the method is realized through fusing mobile phone signalling data and traditional resident investigation data. The method comprises the following steps of: setting a related threshold value through resident trip feature information obtained through traditional resident investigation data on the basisof acquiring and preprocessing original mobile phone signalling data, and converting trip track information in the mobile phone signalling data into a preliminary trip OD distribution matrix; and obtaining a final resident trip OD distribution condition through gross sample expansion. According to the method, the targets of full-sample sampling and sample distribution uniformity are realized underthe condition that resident trip distribution grosses re highly consistent with real trip features, obtained resident trip distribution results are greatly enhanced when being compared with traditional methods, and important theoretical basis and support are provided for the construction of urban traffic facilities and the construction of transit systems.

Description

technical field [0001] The invention relates to the technical field of traffic planning, in particular to a method for extracting OD distribution of residents' trips based on fusion data. Background technique [0002] The distribution of residents' trips has varying degrees of impact on urban space utilization, industrial layout, environmental protection, energy supply, and transportation development. An accurate OD distribution matrix of residents' trips is an important support for the construction of urban transportation facilities and public transport systems. [0003] In the existing technology, the OD distribution of residents' travel is constructed according to the data source, which can be divided into two categories: [0004] One is based on the traditional traffic survey data, which is an important part of the four-stage model; this method is based on regression analysis to count the survey data as traffic generation, and then distribute it to the traffic area with ...

Claims


Application Information

Patent Timeline
IPC IPC(8): G06F17/30G06Q50/30
CPCG06F16/215G06F16/2465G06Q50/40
Inventor 蒋应红狄迪彭庆艳郭高华
Owner SHANGHAI URBAN CONSTR DESIGN RES INST GRP CO LTD
Learn More