Making method and device for visual report, terminal equipment and storage medium

A production method and production device technology, applied in the field of data visualization, can solve the problems of poor synchronization of visual reports and low production efficiency, and achieve the effects of saving production time, improving conversion efficiency, and making the production process simple and convenient.

Inactive Publication Date: 2018-06-15
PING AN TECH (SHENZHEN) CO LTD
View PDF4 Cites 13 Cited by
  • Summary
  • Abstract
  • Description
  • Claims
  • Application Information

AI Technical Summary

Problems solved by technology

[0003] The embodiment of the present invention provides a method for making a visual report to solve the problems of weak synchronism and low production efficiency in the production process of the current visual report

Method used


Image

  • Making method and device for visual report, terminal equipment and storage medium
  • Making method and device for visual report, terminal equipment and storage medium
  • Making method and device for visual report, terminal equipment and storage medium

Examples


Embodiment 1

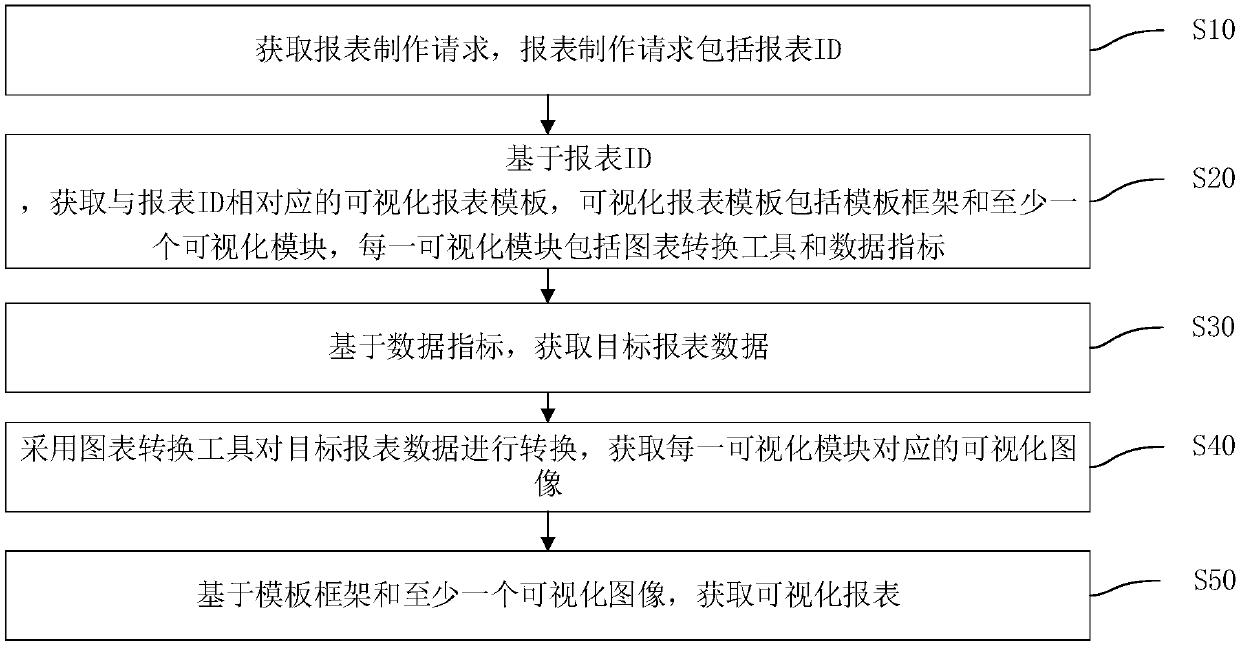
[0029] figure 1 A flow chart showing a method for making a visual report in this embodiment. The method for making a visual report is applied to terminal devices of financial institutions such as banks, securities, insurance, or other institutions, such as a data management system installed for data processing, and is used to analyze various types of reports that may be applied in the data management system. Reports are visualized to increase the visibility of report data and the efficiency of visualization processing, which helps users analyze data. In this embodiment, the method for making a visual report is specifically applied in the brand marketing management system, a data management system, to perform data statistics on brand marketing data, and to make visual reports based on the brand marketing data, which can effectively avoid brand marketing. The problem of weak synchronization and low efficiency of data visualization processing can better improve user experience. ...

Embodiment 2

[0075] Figure 6 A functional block diagram of a device for making a visualized report corresponding to the method for making a visualized report in Embodiment 1 is shown. Such as Figure 6 As shown, the visual report production device includes a report production request acquisition module 10 , a report template acquisition module 20 , a target report data acquisition module 30 , a visualized image acquisition module 40 and a visualized report acquisition module 50 . Among them, the implementation functions of the report production request acquisition module 10, the report template acquisition module 20, the target report data acquisition module 30, the visual image acquisition module 40 and the visual report acquisition module 50 correspond to the steps of the production method of the visual report in the embodiment. Correspondingly, to avoid redundant description, this embodiment does not describe in detail one by one.

[0076] The report preparation request obtaining mod...

Embodiment 3

[0101] This embodiment provides a computer-readable storage medium, and a computer program is stored on the computer-readable storage medium. When the computer program is executed by a processor, the method for making a visual report in Embodiment 1 is implemented. In order to avoid repetition, details are not repeated here. . Alternatively, when the computer program is executed by the processor, the functions of the modules / units in the visualization report production device in Embodiment 2 are realized, and details are not repeated here to avoid repetition.


PUM


Abstract

The invention discloses a making method and device for a visual report, terminal equipment and a storage medium. The making method of the visual report comprises the steps of:acquiring a report makingrequest, wherein the report making request comprises a report ID; based on the report ID, acquiring a visual report template corresponding to the report ID, wherein the visual report template comprises a template framework and at least one visualization module, and each visualization module comprises a chart conversion tool and a data index; based on the data indexes, acquiring target report data; carrying out conversion on the target report data by adopting the chart conversion tools, and acquiring a corresponding visual image of each visualization module; and based on the template frameworkand at least one visual image, acquiring a visual report. The making method of the visual report can achieve an effect that the visual report can be made without enabling the data to be processed bya visualization platform, and is beneficial for improving making efficiency of the visual report and saving making time.

Description

technical field [0001] The present invention relates to the technical field of data visualization, in particular to a method, device, terminal equipment and storage medium for making a visualized report. Background technique [0002] In the report making process of the current data management system, it is necessary to send the data stored in the data management system to the data visualization platform (such as tableau software) for visualization processing, obtain the visualized image, and then send the visualized image to the data management system, so that the data management system Visual report production is performed based on the obtained visual images. In the current visual report production process, the data of the data management system needs to be imported into the data visualization platform for visualization processing, and then the report is produced based on the visual image returned by the data visualization platform, which makes the synchronization of the pr...

Claims


Application Information

Patent Timeline
Patent Type & Authority Applications(China)
IPC IPC(8): G06F17/24
CPCG06F40/18
Inventor 沈杨刘洋洋谢翠萍
Owner PING AN TECH (SHENZHEN) CO LTD
Why Eureka
Try Eureka