Multispectral estimation method of tomato chlorophyll content
A chlorophyll content and multi-spectral technology, applied in the field of crop chlorophyll estimation, to overcome the narrow field of view and solve the effect of image quality degradation
- Summary
- Abstract
- Description
- Claims
- Application Information
AI Technical Summary
Problems solved by technology
Method used
Image

Examples
Embodiment Construction
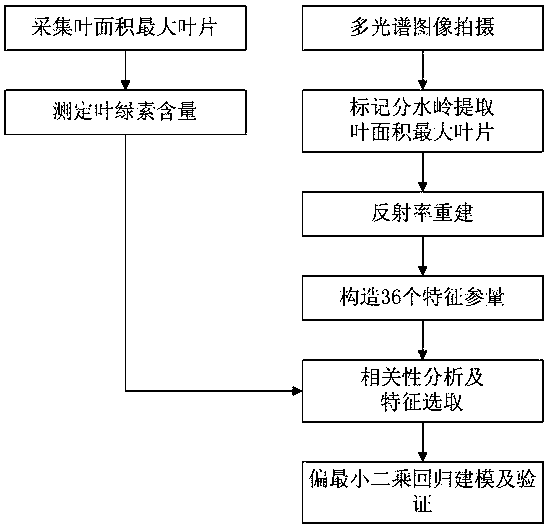
[0026] refer to figure 1 In the flow chart of the steps shown, the embodiment of the present invention provides a multi-spectral estimation method for tomato chlorophyll content, which takes greenhouse tomato as the research object, and acquires multi-spectral images of crop canopies, extracts leaves with the largest leaf area, and uses reflectance. Reconstruction, multispectral image feature definition and selection, partial least squares modeling, and finally a set of tomato chlorophyll content estimation method is proposed, which includes the following specific steps:
[0027] (1) Put the standard emission plate and the leaves in the same field of view, and use the camera to acquire 8 multispectral images in different bands of the crop canopy in the same scene according to the 8 bands that are sensitive to the chlorophyll content of the crop.
[0028] Among them, the eight bands sensitive to the chlorophyll content of crops are 520, 560, 640, 670, 700, 760, 800 and 870nm re...
PUM
 Abstract
Description
Claims
Application Information
 - Generate Ideas
- Intellectual Property
- Life Sciences
- Materials
- Tech Scout
- Unparalleled Data Quality
- Higher Quality Content
- 60% Fewer Hallucinations
Browse by: Latest US Patents, China's latest patents, Technical Efficacy Thesaurus, Application Domain, Technology Topic, Popular Technical Reports.
© 2025 PatSnap. All rights reserved.Legal|Privacy policy|Modern Slavery Act Transparency Statement|Sitemap|About US| Contact US: help@patsnap.com