Rolling curtain display method for comparing temporal GIS version data

A version data, temporal technology, applied in the direction of editing/combining graphics or text, program control devices, user interface execution, etc., can solve the problems of historical information traceability and lack of future power grid development prediction, and achieve the goal of increasing value and improving efficiency. Effect

Inactive Publication Date: 2018-11-23
云南电网有限责任公司信息中心
View PDF5 Cites 8 Cited by
  • Summary
  • Abstract
  • Description
  • Claims
  • Application Information

AI Technical Summary

Problems solved by technology

The traditional GIS system can only reflect the state of the power grid in the recent period, and lacks effective support in terms of historical information tracing and future power grid development prediction

Method used


Image

  • Rolling curtain display method for comparing temporal GIS version data
  • Rolling curtain display method for comparing temporal GIS version data
  • Rolling curtain display method for comparing temporal GIS version data

Examples


Embodiment Construction

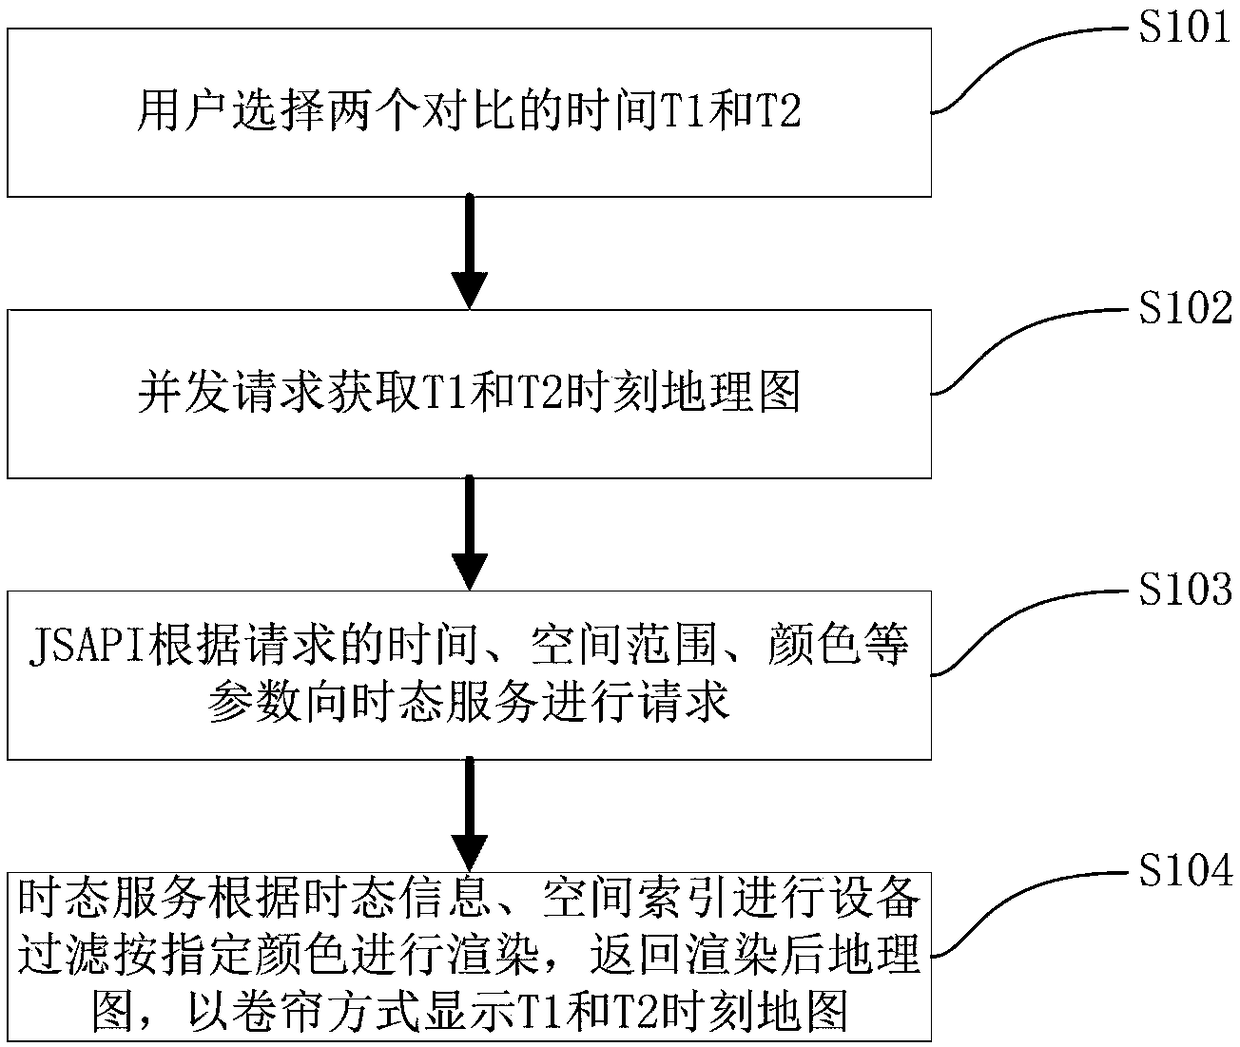
[0014] The specific implementation manner of the present invention is described with reference to the accompanying drawings. refer to figure 1 , is the flow chart of rolling shutter display map data in the present invention, and the specific steps are:

[0015] In S101, the user selects two moments to be compared through the interface;

[0016] In S102, the system concurrently obtains geographic maps at two times from the backend according to the two times selected by the user. The basis of this process is that GIS data is stored temporally. For specific methods, please refer to the practical invention "A Time-based GIS Grid GIS storage model";

[0017] In S103, the JSAPI makes a request to the temporal service according to the requested time, space range, color and other parameters;

[0018] In S104, the temporal service performs device filtering according to the temporal information and the spatial index to render according to the specified color, returns the rendered geo...


PUM


Abstract

According to the rolling curtain display method for comparing temporal GIS version data, the user selects two comparison times, the system performs device filtering according to the temporal information and the spatial index, and renders the image by the specified color, and returns the rendered geographic map, performs difference comparison according to the two times, calculates new equipment, modified equipment, deleted equipment, packs and returns the difference list. The method can view the change of the power equipment in the same position according to the linkage display of the mouse atthe same position, and obtain the difference between the two historical nodes of the power grid, which will play an important role in the operation management and planning prediction of the power grid, and improve the power, improve the functional location of power GIS in power grid equipment and the status and value of topological network data as a "data source" in grid information systems. According to the rolling curtain display method for comparing temporal GIS version data, the management requirements tend to be refined, the development transition of the power grid is displayed accuratelyand visually, the demands of the planning construction of future power grid , engineering design and the like are auxiliary predicted, and certain decision support is provided for work of overhaul and technical changes, state maintenance and the like.

Description

technical field [0001] The invention relates to the field of display and comparative analysis of electric power GIS, in particular to a rolling-blind display method for temporal GIS version data comparison. Background technique [0002] With the increasing scale of the power grid, the development and change of the power grid is accelerating. How to accurately and intuitively display the development and changes of the power grid scale and wiring, and predict the law of future power grid planning and construction. The traditional GIS system can only reflect the state of the power grid in the recent period, and lacks effective support in terms of historical information tracing and future power grid development prediction. Quickly display the historical changes of the power grid network topology through time playback, and analyze the differences between the two historical nodes of the power grid through the comparison of power grid structures in different time periods. Its appea...

Claims


Application Information

Patent Timeline
Patent Type & Authority Applications(China)
IPC IPC(8): G06T11/60G06F9/451
CPCG06F9/451G06T11/60
Inventor 李申章张建文马文张榆杨泳丹王海林
Owner 云南电网有限责任公司信息中心
Why Eureka
Try Eureka