Instantaneous frequency analysis and diagnosis method aiming at bearing vibration signal
A technology of instantaneous frequency and diagnosis method, which is applied in measuring devices, instruments, and ultrasonic/sonic/infrasonic waves, etc., can solve the problems of inaccurate estimation of instantaneous frequency, difficult to effectively decompose, blurred spectrum, etc., to improve separation accuracy, The effect of solving spectral blur problem and improving estimation accuracy
- Summary
- Abstract
- Description
- Claims
- Application Information
AI Technical Summary
Problems solved by technology
Method used
Image
Examples
Embodiment 1
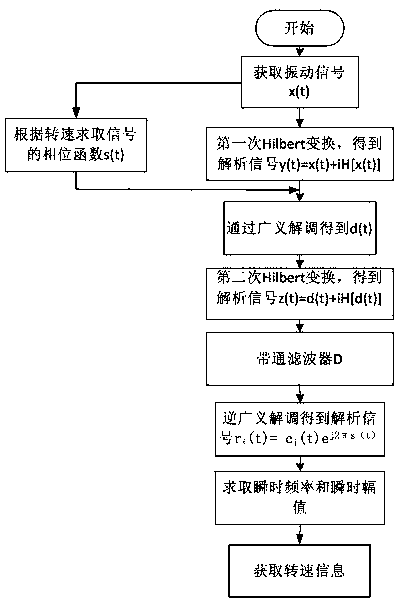
[0032] Step 1: Bearing vibration signal under variable speed conditions ,Described as follows:
[0033]
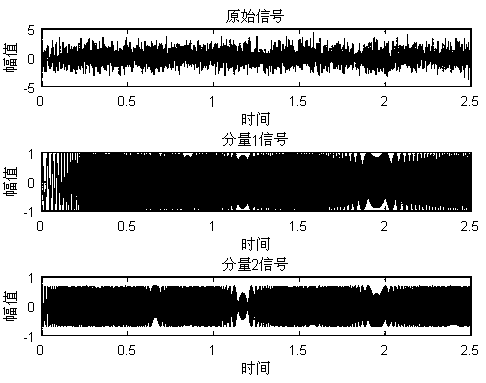
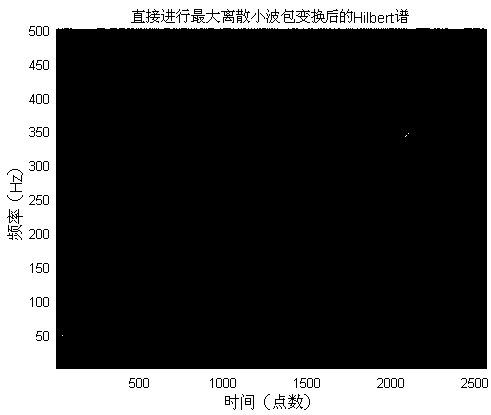
[0034] in, It is Gaussian white noise, the signal-to-noise ratio is 3dB, the sampling frequency is 1024Hz, and the sampling time is 2.5s. The time domain waveform of figure 2 shown. right Carry out the maximum discrete wavelet packet transform, when the frequency spectrum is as image 3 Shown; use the maximum energy method to separate out the harmonic components with the most significant energy in the spectrogram , for the next analysis.
[0035] Step 2: Use the least squares method to fit the harmonic components obtained in step 1 , and then get its phase function
[0036] .
[0037] Step 3: To vibration signal Carry out Hilbert transform to get the analytical signal ,in yes The Hilbert transform.
[0038] Step 4: According to the phase function obtained in step 2 ,right Perform generalized demodulation to get the signal .
[0039] Ste...
Embodiment 2
[0045] Step 1: Bearing vibration signal under variable speed conditions ,Described as follows:
[0046] in , the sampling frequency of the signal is 1024Hz, the sampling time is 1s, the signal The time domain waveform of Image 6 shown. right Carry out the maximum discrete wavelet packet transform, when the frequency spectrum is as Figure 7 Shown; use the maximum energy method to separate out the harmonic components with the most significant energy in the spectrogram , for the next analysis.
[0047] Step 2: Use the least squares method to fit the harmonic components obtained in step 1 , to obtain the fundamental frequency component containing the rotational speed information; and use the curve fitting function to obtain the parameters of the phase function, and finally obtain the phase function .
[0048] Step 3: To vibration signal Carry out Hilbert transform to get the analytical signal ,in yes The Hilbert transform.
[0049] Step 4: According to...
Embodiment 3
[0056] Step 1: Bearing vibration signal under variable speed conditions ,Described as follows:
[0057]
[0058] Among them, the sampling frequency of the signal is 1024Hz, the sampling time is 1s, and the signal The time domain waveform of Figure 10 shown. right Carry out the maximum discrete wavelet packet transform, when the frequency spectrum is as Figure 11 Shown; use the maximum energy method to separate out the harmonic components with the most significant energy in the spectrogram , for the next analysis.
[0059] Step 2: Use the least squares method to fit the harmonic components obtained in step 1 , to obtain the fundamental frequency component containing the rotational speed information; and use the curve fitting function to obtain the parameters of the phase function, and finally obtain the phase function .
[0060] Step 3: To vibration signal Carry out Hilbert transform to get the analytical signal ,in yes The Hilbert transform.
[0061...
PUM
 Abstract
Description
Claims
Application Information
 - R&D
- Intellectual Property
- Life Sciences
- Materials
- Tech Scout
- Unparalleled Data Quality
- Higher Quality Content
- 60% Fewer Hallucinations
Browse by: Latest US Patents, China's latest patents, Technical Efficacy Thesaurus, Application Domain, Technology Topic, Popular Technical Reports.
© 2025 PatSnap. All rights reserved.Legal|Privacy policy|Modern Slavery Act Transparency Statement|Sitemap|About US| Contact US: help@patsnap.com


