Apparatus and method for displaying a spectral density graph

A technology of spectral density and spectral data, which is applied in the field of display devices of spectral density maps, and can solve problems such as poor effect

Active Publication Date: 2020-09-22
SHENZHEN CITY SIGLENT TECH
View PDF5 Cites 0 Cited by
  • Summary
  • Abstract
  • Description
  • Claims
  • Application Information

AI Technical Summary

Problems solved by technology

In this way, when the external input parameters change greatly, for example, when the analysis bandwidth is adjusted from the initial large value to a small value, the display effect will become very poor, so that the displayed image is no longer valid reflect the probability of signal occurrence

Method used


Image

  • Apparatus and method for displaying a spectral density graph
  • Apparatus and method for displaying a spectral density graph
  • Apparatus and method for displaying a spectral density graph

Examples


Embodiment Construction

[0032] The present invention will be further described in detail below through specific embodiments in conjunction with the accompanying drawings. The characteristics, operations or characteristics described in the specification can be combined in any appropriate manner to form various embodiments.

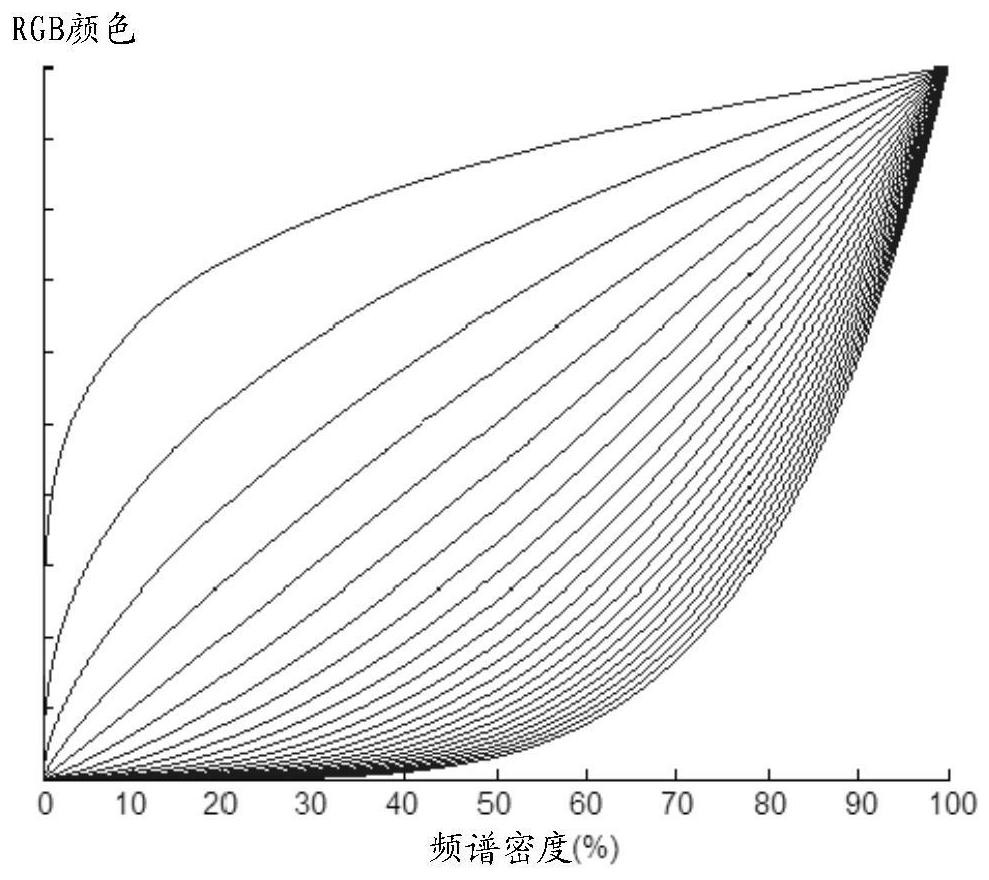
[0033] The RGB color mode is a color standard in the industry. It obtains a variety of colors by changing the three color channels of red (R), green (G), and blue (B) and superimposing them with each other. Yes, RGB is the color representing the three channels of red, green and blue.

[0034] In real-time spectrum analysis, the analysis bandwidth (SPAN) refers to the frequency span measured within the display screen range, and the resolution bandwidth (RBW) represents the minimum bandwidth difference between two different frequency signals that can be clearly distinguished. The signal observation period set by the user can be as long as tens of seconds, and as short as the refres...


PUM


Abstract

The display device and method of a spectral density map are disclosed. The method is characterized in that a signal preprocessing module collects signals and carries out FFT processing to obtain spectral data; a waveform mapping control module calculates the intensity value of the spectral data to obtain intensity value data; a spectral density value calculation module calculates a spectral density value corresponding to each pixel point according to the intensity value data; a conversion function determining module carries out histogram statistics on the spectral density value and determinesa conversion function for converting the spectral density value into RGB data according to an obtained histogram and a preset rule; and an RGB conversion module converts the spectral density value into the RGB data according to the conversion function, and then displays the data through a display module. The distribution rule of the spectral density value is changed along with the changes of an external input parameter, and the conversion function determined according to the distribution rule of the spectral density value is also adjusted so that a displayed spectral density map can also be automatically adjusted and the probability of signal occurrence can be really and effectively reflected.

Description

technical field [0001] The invention relates to the technical field of test and measurement, in particular to a display device and method for a spectral density graph. Background technique [0002] Spectrum analysis technology is a common technology in RF microwave design and testing. Compared with traditional scanning spectrum analysis technology, the real-time spectrum analysis technology that has emerged in recent years can use fast Fourier transform (FFT) to realize broadband real-time Seamless processing, will not miss any details of the signal, it has the advantages of fast processing speed and seamless processing, so it has been more and more widely used in the field of modern test and measurement, such as wireless communication signal detection, wireless spectrum monitoring, radar Target monitoring, circuit fault diagnosis, etc. [0003] In real-time spectrum analysis, the user sets the signal observation period, and then continuously collects the data in the observ...

Claims


Application Information

Patent Timeline
Patent Type & Authority Patents(China)
IPC IPC(8): G01R23/16G01R23/165G01R23/18
CPCG01R23/16G01R23/165G01R23/18
Inventor 王永添李振军郑文明
Owner SHENZHEN CITY SIGLENT TECH
Why Eureka
Try Eureka