Unlock instant, AI-driven research and patent intelligence for your innovation.

A Time-Frequency Analysis Method in Resonance Imaging Based on Seismic Data

A technology of resonance imaging and seismic data, applied in the field of exploration, can solve problems such as non-unique solutions, noise interference, inappropriateness, etc.

Active Publication Date: 2020-06-05
国勘数字地球(北京)科技有限公司 +1
View PDF5 Cites 0 Cited by
  • Summary
  • Abstract
  • Description
  • Claims
  • Application Information

AI Technical Summary

Problems solved by technology

[0004] In the process of time-frequency analysis of seismic data, noise interference, poor data quality, lack of prior information, insufficient data volume and other conditions will lead to problems such as non-existence, non-unique solution, or unstable solution during time-frequency analysis and inversion of data.
In order to overcome the possible inappropriateness, ill-conditioned calculation process and large-scale calculation problems in the inverse problem of time-frequency analysis of seismic surface wave data

Method used


Image

  • A Time-Frequency Analysis Method in Resonance Imaging Based on Seismic Data
  • A Time-Frequency Analysis Method in Resonance Imaging Based on Seismic Data
  • A Time-Frequency Analysis Method in Resonance Imaging Based on Seismic Data

Examples


Embodiment Construction

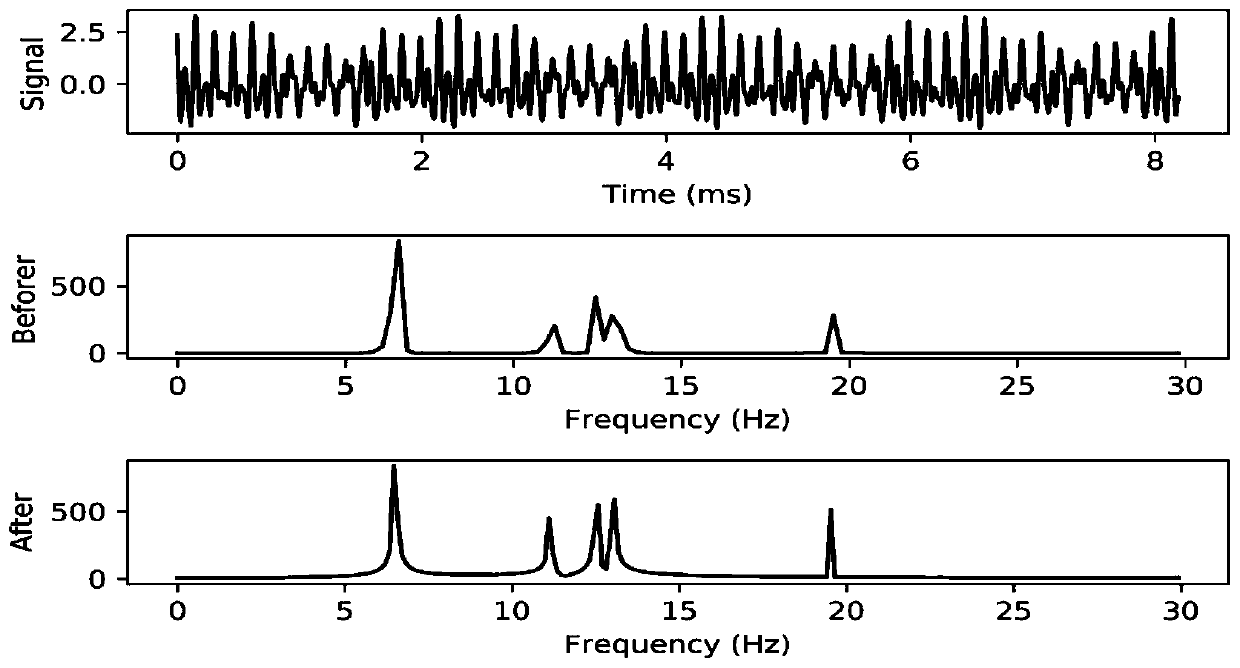
[0024] We can reduce the problem of time-frequency analysis of seismic surface waves to the following equation:

[0025] Mf=d (1)

[0026] Among them, f represents the frequency coefficient, d represents the seismic surface wave data with noise, M represents the kernel matrix of real or complex sinusoidal basis functions,

[0027] M(t,x)=cos(2π·k·Δx·n·Δt)+isin(2π·k·Δx·n·Δt) (2)

[0028] Among them, k represents the frequency domain sampling index, Δx represents the frequency increment, n represents the time sampling index, and Δt represents the time increment.

[0029] The solution to the above formula can generally be obtained by the following formulas (3) and (4):

[0030] m * Mf=M * f (3)

[0031] f=(M * M) ―1 m * d (4)

[0032] If M is an orthogonal matrix, then M * M=I, at this moment the least squares solution of formula (1) can be by f=M * d is obtained, that is, the discrete Fourier transform (DFT). However, in actual seismic data, the elements of M are usu...


PUM


Abstract

The invention relates to a time-frequency analysis method based on seismic data resonance imaging. The method is based on the sparse optimization algorithm and the Tikhonov regularization theory, andintroduces the Lagrange multiplier, controls the step size and adopts the Newton iteration calculation to obtain the optimal solution of the frequency coefficient. The method improves the speed of imaging analysis, and the resolution and the accuracy of imaging, so that the method can be effectively applied to the fine imaging of underground space.

Description

technical field [0001] The invention relates to the technical field of exploration, in particular to a time-frequency analysis method in resonance imaging based on seismic data. Background technique [0002] In nature, any substance has its own natural frequency, including various underground plasms. When a broadband vibration propagates to the geological body, the characteristic natural frequency energy will be amplified. By observing the amplified characteristic frequency signal, the characteristic frequency signal can be imaged to obtain underground fine imaging effect. At present, the resonance imaging method is widely used, such as identifying the structure of the underground medium and stratifying it in large-scale civil engineering, evaluating the reinforcement effect of the foundation, seismic design of construction engineering, non-destructive testing of the quality of roads and airport runways; exploration of environmental geology The distribution range of karst c...

Claims


Application Information

Patent Timeline
Patent Type & Authority Patents(China)
IPC IPC(8): G01V1/30
CPCG01V1/30
Inventor 周艳伟李振宏胡建民陈虹梁霞公王斌施炜
Owner 国勘数字地球(北京)科技有限公司