A method for predicting the trajectory of underwater vehicles based on pressure distribution
A technology for underwater vehicles and motion trajectories, which is applied in directions such as navigation through speed/acceleration measurement, and can solve problems such as prediction of underwater vehicle motion trajectories
- Summary
- Abstract
- Description
- Claims
- Application Information
AI Technical Summary
Problems solved by technology
Method used
Image
Examples
Embodiment 1
[0053] The vehicle is located in a level 5 wave water environment with a water depth of 20m, and the initial speeds in the x and y directions are 2m / s and 20m / s, respectively. The pressure measuring point arrangement scheme adopted is scheme 2.
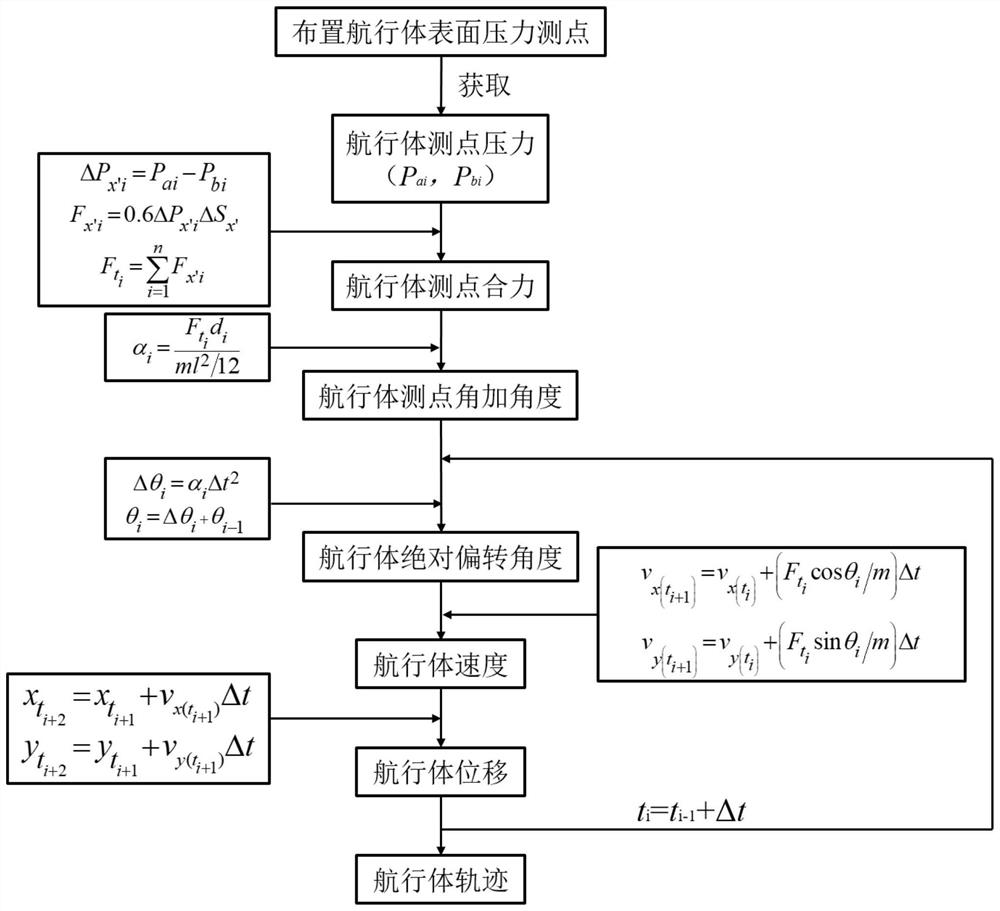
[0054] The specific process of a calculation method for predicting the motion trajectory of an underwater vehicle based on the pressure distribution, such as figure 1 As shown, it is mainly realized by the following steps:
[0055] Step 1: Arrange the pressure measuring points on the surface of the vehicle;
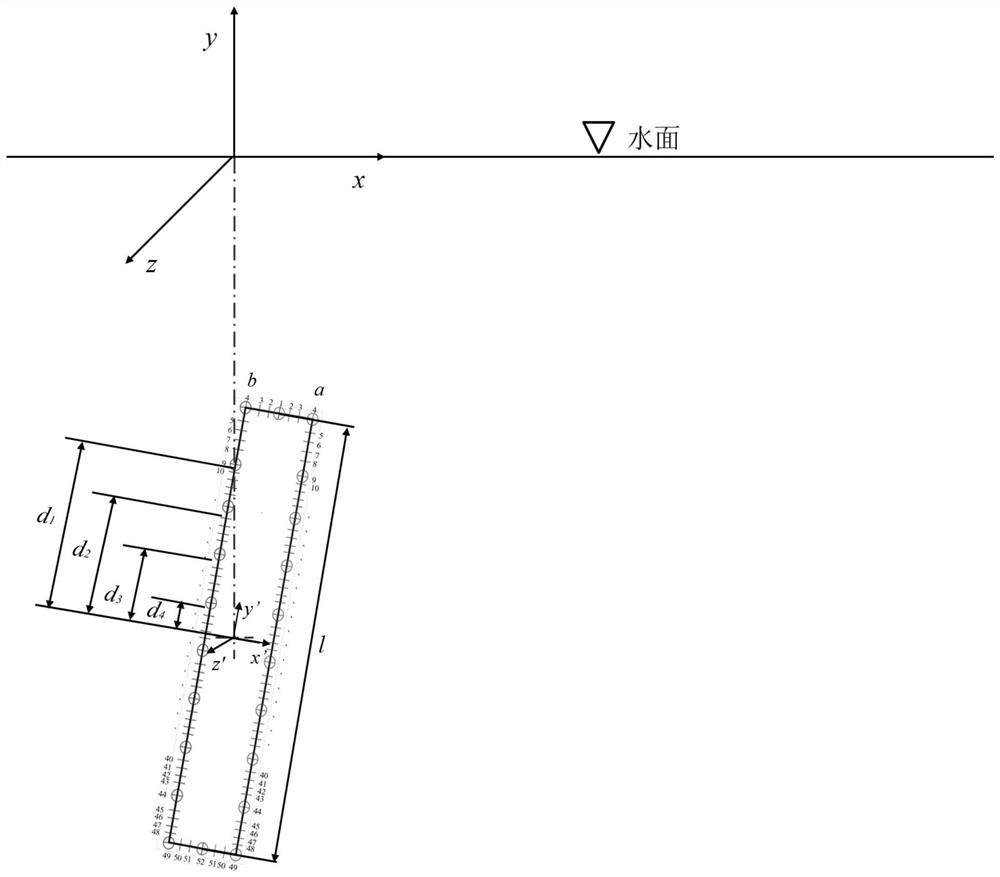
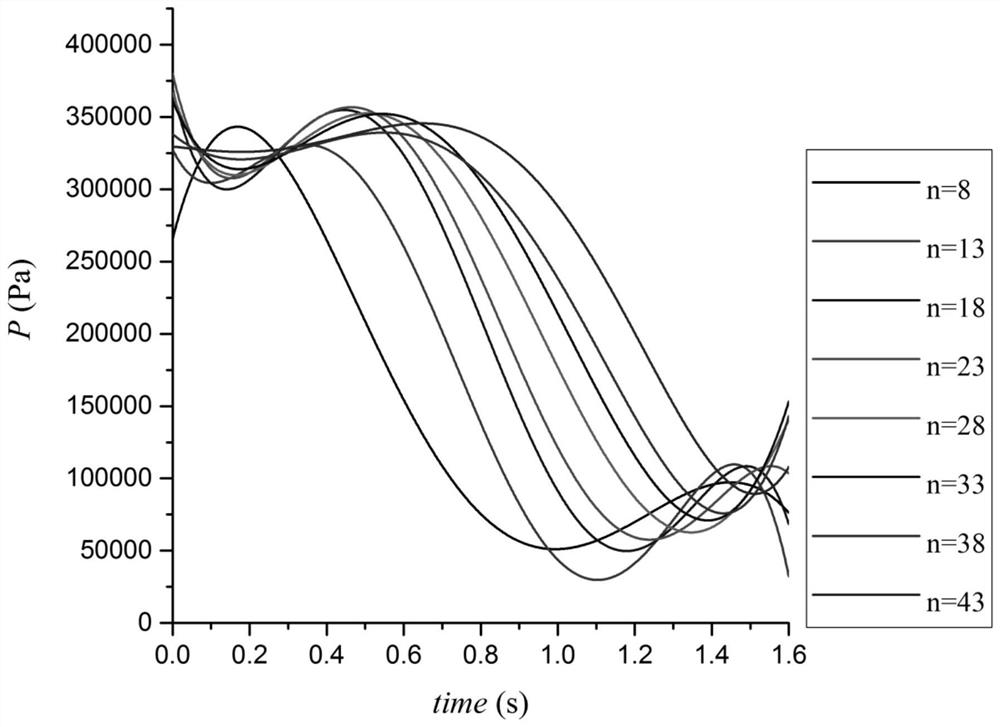
[0056] Based on the underwater vehicle test, pressure measuring points are arranged on the surface of the vehicle. The number of pressure measuring points on one side of the vehicle is 52, and the numbers gradually increase from the head to the tail. The numbers of the pressure measuring points on the front and back surfaces are the same, and the total number of measuring points For 102, such as figure 2 As shown; the distribution pla...
Embodiment 2
[0088] The vehicle is located in a level 5 wave water environment with a water depth of 20m. The initial speeds in the x and y directions are 2m / s and 20m / s, respectively. The pressure measurement point arrangement scheme adopted is scheme 10.
[0089] The specific process of a calculation method for predicting the motion trajectory of an underwater vehicle based on the pressure distribution is the same as in Case 1. The predicted motion trajectory is as follows Picture 11 Shown.
[0090] Based on the pressure measuring point combination layout plan in Table 1, the motion trajectory prediction of 13 sets of plans is given, such as Picture 12 Shown. Taking the experimental measurement at a distance of 20m from the water surface to 1m as the criterion for the deviation error, Table 2 shows the deviation error of the 13 pressure measurement point combination distribution in Table 1.
[0091] Table 2 Deviation error of 13 pressure measuring point distribution schemes
[0092]
PUM
 Abstract
Description
Claims
Application Information
 - R&D
- Intellectual Property
- Life Sciences
- Materials
- Tech Scout
- Unparalleled Data Quality
- Higher Quality Content
- 60% Fewer Hallucinations
Browse by: Latest US Patents, China's latest patents, Technical Efficacy Thesaurus, Application Domain, Technology Topic, Popular Technical Reports.
© 2025 PatSnap. All rights reserved.Legal|Privacy policy|Modern Slavery Act Transparency Statement|Sitemap|About US| Contact US: help@patsnap.com


