
A no-reference image quality evaluation method based on independent component analysis
An independent component analysis and image quality technology, applied in image analysis, image data processing, instruments, etc., can solve the problems of unsatisfactory natural image quality effect, inability to characterize image quality well, and poor subjective consistency.
- Summary
- Abstract
- Description
- Claims
- Application Information
AI Technical Summary
Problems solved by technology
Method used
Image

Examples
Embodiment Construction
[0046] Below in conjunction with accompanying drawing, technical scheme of the present invention is described in further detail:
[0047] A no-reference image quality assessment method based on independent component analysis, including the following steps:
[0048] Step 1), for each image in the LIVE2 image library, select five image quality blocks:
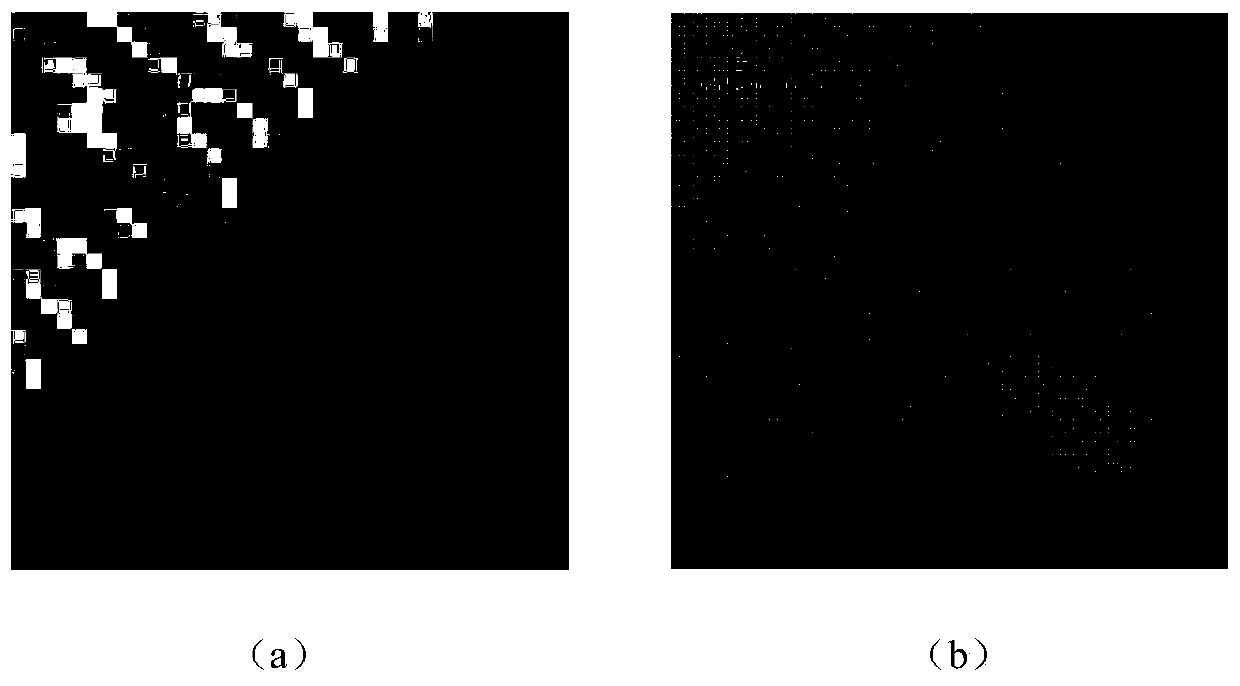
[0049] Step 1.1), generate a scatterplot of each image, figure 1 (a), figure 1 (b) are the original image and scatter plot of the image respectively;
[0050] Step 1.2), calculate the spread width I of the scatter plot w ;
[0051]Step 1.3), sliding a 32×32 window on the image to obtain all 32×32 image blocks, and calculating the scatter width I of the pixel-to-scatter diagram in each image block pw ;
[0052] Step 1.4), for each image block, calculate its spreading width I p w and i w The ratio of is used as the RWID value of the image block;
[0053] Step 1.5), classify each image block according to the range of the fo...
PUM
 Abstract
Description
Claims
Application Information