Stock index extreme value prediction method based on top view algorithm

A stock index and prediction method technology, applied in the computer field, can solve problems such as poor anti-noise ability and inability to effectively identify time series signals, and achieve the effect of weakening the impact

Inactive Publication Date: 2019-08-06
HANGZHOU NORMAL UNIVERSITY
View PDF0 Cites 1 Cited by
  • Summary
  • Abstract
  • Description
  • Claims
  • Application Information

AI Technical Summary

Problems solved by technology

The results show that: the horizontal visual graph network cannot effectively identify various time series signals (periodic, fractal, chaotic); for fractal signals, the visual graph and the finite traversal visual g

Method used


Image

  • Stock index extreme value prediction method based on top view algorithm
  • Stock index extreme value prediction method based on top view algorithm
  • Stock index extreme value prediction method based on top view algorithm

Examples


Example Embodiment

[0040] Further illustrate technical scheme of the present invention below in conjunction with accompanying drawing:

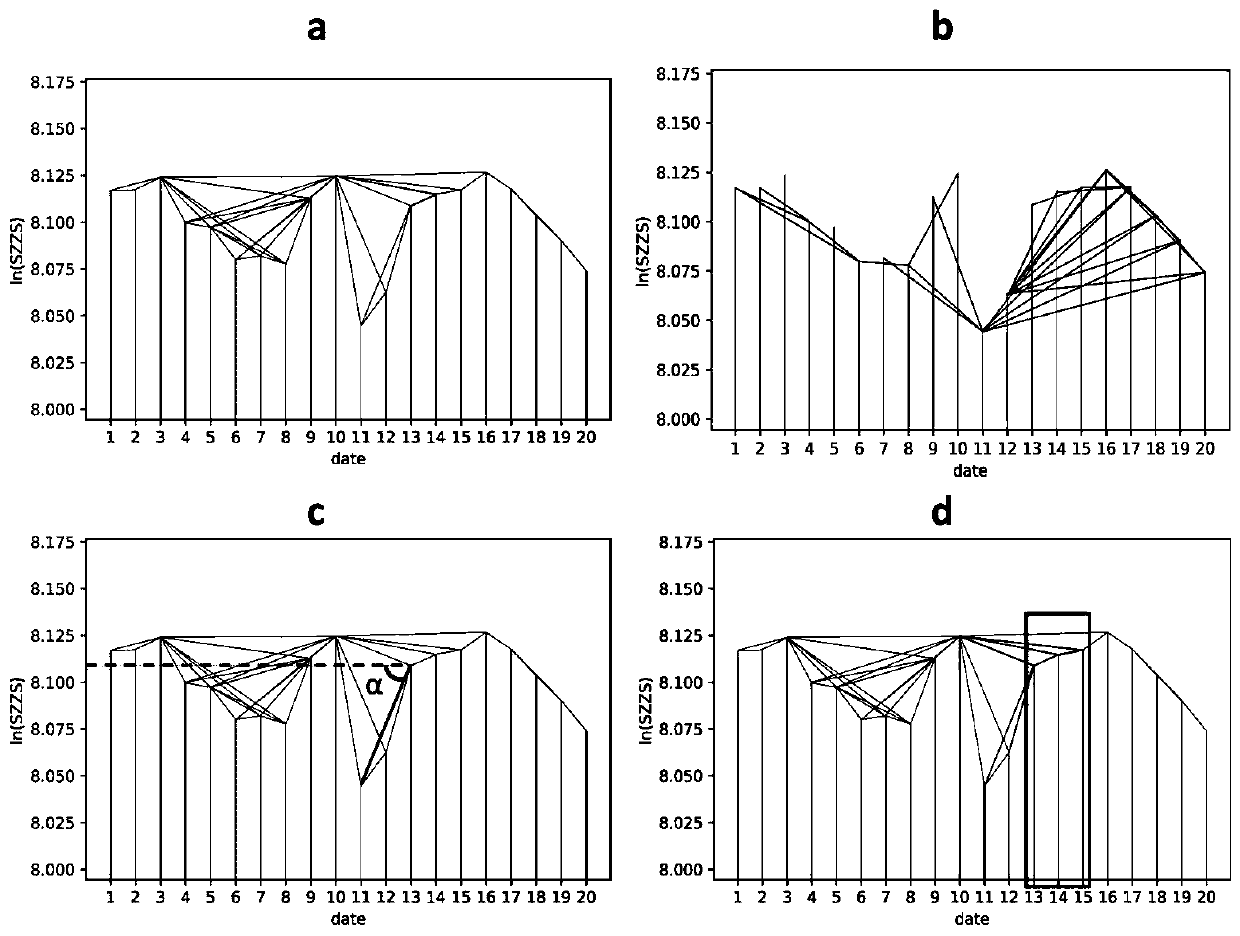
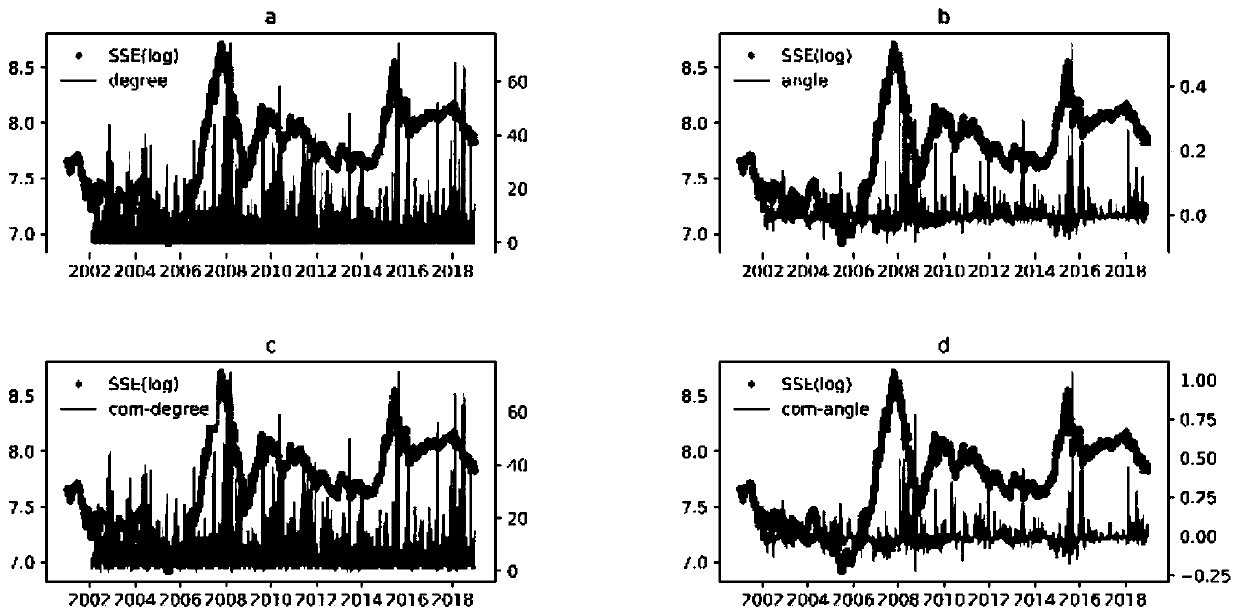
[0041] Analyzing the visible graph algorithm and the completely invisible graph algorithm that maps time series to complex networks, it is found that it has two defects: loss of detail information and susceptibility to interference from adjacent values. To address these two defects, this patent proposes a weighted view algorithm based on top view and a view algorithm based on neighbor communities. Correspondingly, these two algorithms are also applicable to completely invisible views.

[0042] The extreme value prediction of the stock index based on the visual map algorithm of the bird's-eye view includes the following contents:

[0043] Data collection module:

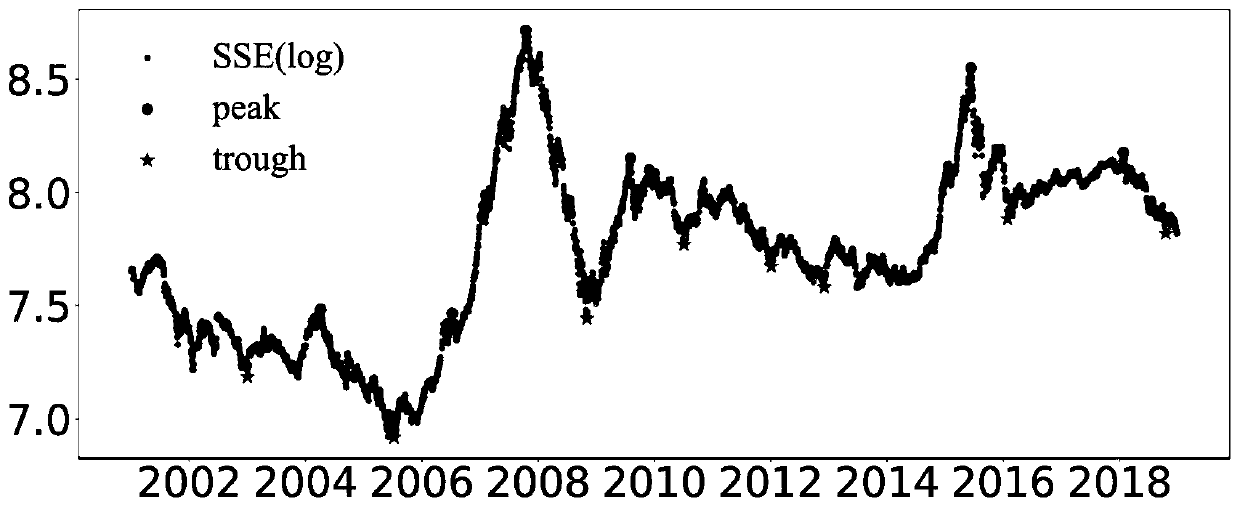
[0044] The data used in this patent is the public data of the financial market, and the data source is https: / / finance.yahoo.com / world-indices, from which we select 12 stock indices. The indices and t...


PUM


Abstract

The invention relates to a stock index extreme value prediction method based on a top view algorithm. The method comprises an extreme value definition module, a visual graph network construction module, a completely unviewable graph network construction module, a weight-considering visual graph network construction module, a weight-considering unviewable graph network construction module, an extreme value prediction index construction module and an evaluation index construction module. According to the method, the defect that the time sequence is mapped into the complex network by using the visual graph algorithm is improved, the extreme value in the financial time sequence is predicted by using the improved method, and the prediction effect of the improved method is better. According to the method, more detail information is reserved in the process of mapping a time sequence to a complex network through a weighted visual graph algorithm based on an overlook angle; through a visual graph algorithm based on neighbor communities, the influence of adjacent nodes on the observation nodes is weakened.

Description

technical field [0001] The invention belongs to the field of computer technology, and relates to analysis and prediction of financial time series, and is especially applicable to the problem of extreme value prediction of stocks and stock indexes, and specifically relates to a method for predicting extreme values ​​of stock indexes based on a bird's-eye view visual graph algorithm. Background technique [0002] Nonlinear time series analysis is an active area of ​​research. Studying the structure of complex signals can yield information about the processes that generate these sequences, helping us to understand, model, and predict sequences. Over the past few years, scholars have proposed several methods for mapping time series to complex networks. Among these methods, the visual graph algorithm has received more attention due to its low complexity and good geometric properties. Applying the methods of complex network theory to characterize time series makes complex network...

Claims


Application Information

Patent Timeline
IPC IPC(8): G06Q10/04G06Q40/04
CPCG06Q10/04G06Q40/04
Inventor 刘闯陈东瑞张子柯
Owner HANGZHOU NORMAL UNIVERSITY
Why Eureka
Try Eureka