A method for identifying the relationship between households in a low-voltage station area

A low-voltage station area and relationship identification technology, applied in the field of data analysis, can solve the problems of high maintenance cost, difficult to determine the ownership of household meter power supply, and high line loss.

Active Publication Date: 2021-05-04
STATE GRID SHAANXI ELECTRIC POWER RES INST +2
View PDF15 Cites 0 Cited by
  • Summary
  • Abstract
  • Description
  • Claims
  • Application Information

AI Technical Summary

Problems solved by technology

If the matching between the energy meter at the gateway and the user’s energy meter is not accurate, the corresponding addresses of the two parties will be different, and the line loss will be too high or the line loss will be negative when calculating the line loss in the later period.
[0003] For problems that cannot be accurately identified between users and gateways, the traditional method is on-site comparison and investigation, but based on the complexity of the power supply environment that may arise during on-site operations, it may be difficult to determine the ownership of the household meter power supply, and a lot of manpower and material resources will be wasted; However, the existing devices required for judgment using hardware are more complicated, and the cost of installation and later maintenance is relatively high; conventional big data analysis algorithms directly calculate the correlation coefficient for judgment or perform cluster analysis on this basis, and these methods require repeated calculations The daily correlation coefficient between users and gateways requires a large amount of calculation and cannot simultaneously identify the relationship between households and phases of stations with different attributes

Method used


Image

  • A method for identifying the relationship between households in a low-voltage station area
  • A method for identifying the relationship between households in a low-voltage station area
  • A method for identifying the relationship between households in a low-voltage station area

Examples


Embodiment

[0060] see Figure 1 to Figure 5 , in the embodiment of the present invention, utilize MATLAB (also can be other machine language) programming to realize a kind of station-household relationship and meter-phase relationship identification method based on smart energy meter collection data, comprising:

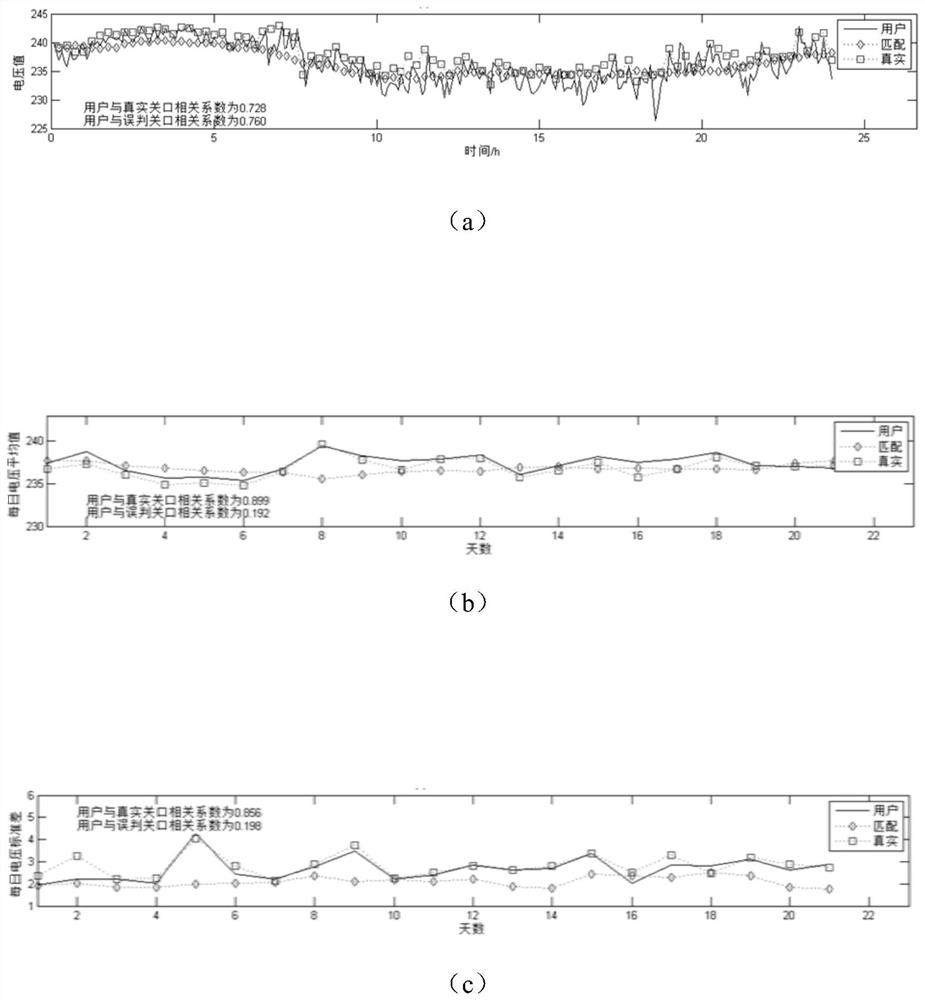
[0061] 1. The 25-day data of 55 users and 10 gates in a station area provided by Shaanxi Electric Power Company, among which the smart energy meters of users collect 288 time points every day, and the smart energy meters of gates collect 96 time points every day.

[0062] 2. If figure 1 As shown, "user" means the data of a certain user in the station area, "misjudgment" means the wrong gateway data identified by the traditional correlation coefficient method, and "true" means the physical corresponding gateway data of the user; as shown in Figure (a), use The correlation coefficient between the "misjudgment" gate and "user" misjudged by the traditional method is 0.81, and the ...


PUM


Abstract

The invention discloses a method for identifying the household relationship in a low-voltage station area based on data collected by an intelligent electric energy meter, which includes: collecting and acquiring a preset number of gateway intelligent electric energy meters and preset days of user intelligent electric energy meters in the low-voltage station area to be identified The original voltage data of the smart energy meter is cleaned to obtain the effective data of each smart energy meter; according to the obtained effective data of each smart energy meter, the daily average value and standard deviation of the voltage of the smart energy meter are calculated; the user's smart energy Correlation analysis is performed on the average and standard deviation value series of the meter and the smart energy meter at the gateway respectively; The maximum value is determined as a match. The identification method of the present invention is based on the big data analysis method, and the amount of calculation is relatively small; it can accurately identify the relationship between the station and the table, and estimate the correct rate of identification.

Description

technical field [0001] The invention belongs to the technical field of data analysis, relates to the technical field of big data analysis of a smart electric energy meter digital metering system in a low-voltage station area of ​​a distribution network, and in particular to a method for identifying household relationships in a low-voltage station area based on data collected by an intelligent electric energy meter. Background technique [0002] The gateway electric energy meter refers to the metering device installed and operated in the station area and connected to the user's electric energy meter. It is used for trade settlement and internal economic index assessment, and plays an important role in the electric energy metering of the entire power grid. By calculating and analyzing line loss, we can find the distribution law of electric energy loss in the power grid, expose management and technical problems, provide theoretical and technical basis for loss reduction work, an...

Claims


Application Information

Patent Timeline
Patent Type & Authority Patents(China)
IPC IPC(8): G01R31/00G06F17/15
CPCG01R31/00G06F17/15
Inventor 宋晓林贺云隆黄璐涵张院锋薛倩楠张小平曾翔君陈玥骆一萍
Owner STATE GRID SHAANXI ELECTRIC POWER RES INST
Why Eureka
Try Eureka